What is Tracking?
The ultimate benefit of using an all-in-one system like Ontraport is that all your data is in one place, meaning you have the most comprehensive, accurate source of information possible about your customers and your business. With that information at your fingertips, you’re primed to make smart decisions about how to create better experiences for your customers so that you’ll generate better results, how to allocate your budget and resources to optimize your marketing campaigns, and how to tackle your greatest opportunities for growth.
In Ontraport, there are various ways to view and analyze your data and numerous tracking features that work together to accumulate the data. Ontraport is constantly tracking all of your contacts’ interactions behind the scenes, including which emails they open, which pages they visit, and which products they purchase.
Tracking Features
Overall stats
![]()
Think of the dashboard as the place to go when you want to see an overview of all the stats you are interested in across your whole account. There are two ways to view this data:
- Trends Dashboard: Use your Trends Dashboard if you want to see your stats displayed in graphs that show you your business metrics over time. Every chart has unique filters that help you see the exact information you want. Plus, you can customize the layout of your trends page to organize your charts and choose which ones you want to display.
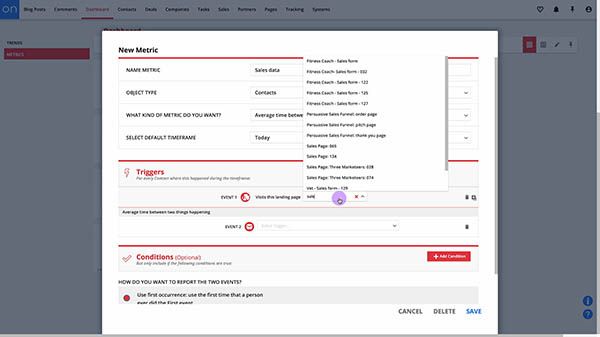
- Metrics Dashboard:The Metrics Dashboard shows you data in real-time so you can stay on top of the information that is most relevant to your business. If you know the stats you want to check in on every day, build a metric for it and Ontraport will automatically track it for you. You have the option to name, categorize and refine each metric, and your dashboard can be as simple or in-depth as you want.
Automation performance
![]()
Performance Mode is a view within each of your automation maps that allows you to keep track of automation results in real time. You can see reports that show you how contacts have moved through your automation map, get an in-depth look at which elements are most effective at driving conversions, understand your goal conversion rates, and more.
Performance Mode Stats and Reports
Sales reports
![]()
Your Ontraport account lets you see every sale you’ve made and create sales reports. You will be able to see every successful and failed transaction, how many subscription plans your clients are currently on, and any other sales-related analytics you are interested in.
Page performance
![]()
Every Ontraport page and pages on WordPress sites that have the PilotPress plugin installed automatically track visits.
Email performance
![]()
You can view open and click rates for your emails in a variety of ways to better understand how your messages are resonating with your audience.
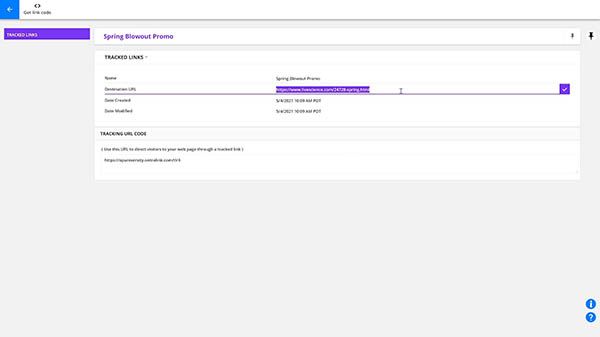
Lead source tracking
![]()
You can track where your customers are coming from based on which links they click, such as specific ads, links in emails, links to your pages from blog articles or elsewhere, and more.
Tracking Activities
Measure Automation Performance
View stats right on your automation map to understand your results and make improvements.
Create a personalized display of all your account’s measurable stats.