There’s actually a lot of misleading data out there. That’s not to say that tracking tools necessarily do a bad job at collecting the data but rather that they don’t always display the data in a clear, comprehensive way. Many tracking systems show stats a certain way by default, but those might not really be the ideal way to understand them.
As more companies have begun favoring digital advertising, many have also begun to question exactly how to measure advertising success. There are no universal digital advertising metrics, and many marketing tracking tools use different methodologies for measurement.
This leaves many marketers skeptical of marketing tracking but conflicted because advertising metrics are not something to overlook. You need data to make smarter decisions for your business, but you wonder what numbers you can really trust.
There are some common concerns many marketers face when it comes to popular platforms, such as Google Ads and Facebook, but there are steps to get around the deceiving stats so you can see the real numbers. Here are some things to be aware of before you set up your next marketing campaign to get your marketing tracking off on the right foot.

Don’t pay attention to “clicks (all).”
Did you know Facebook has five different click metrics? The metrics are:
- Clicks (all)
- Social clicks
- Outbound clicks
- Link clicks
- Button clicks
If you advertise on Facebook, the default is to show you “clicks (all),” which is always the highest number. It’s quite literally any click on your ad, including likes, comments, shares and even clicks on your profile thumbnail image.
Many marketers dismiss Facebook likes as vanity metrics or “meaningless figures that one should avoid when trying to prove the value of social activity.” This is because many Facebook users mindlessly like random posts on their feed, without even clicking the ad itself. Yet, all of this activity is counted in this “clicks (all)” metric, which can skew your CPC (cost-per-click) and make you think some ads are more effective than they really are.
Do pay attention to “link clicks.”
The more useful and accurate “click” metric to look at is “link clicks.”
This number signifies the people who click on the specific link you specify in the ad set-up process and is the number that really matters. Because the “link clicks” metric doesn’t count the meaningless “clicks” on your ads, you get a more accurate view of how well your ad is actually performing.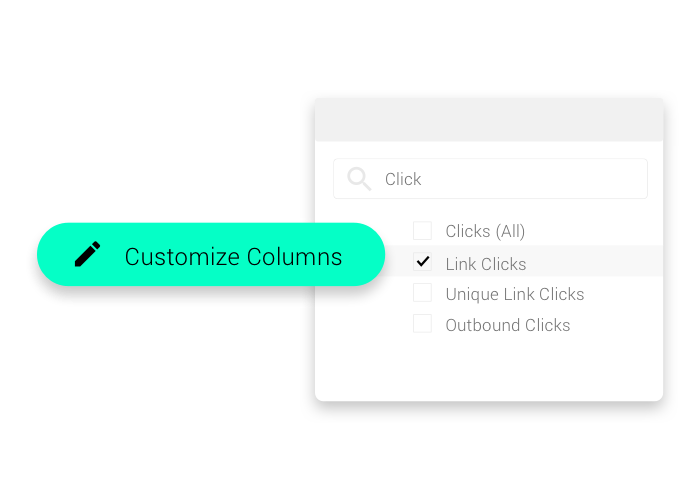
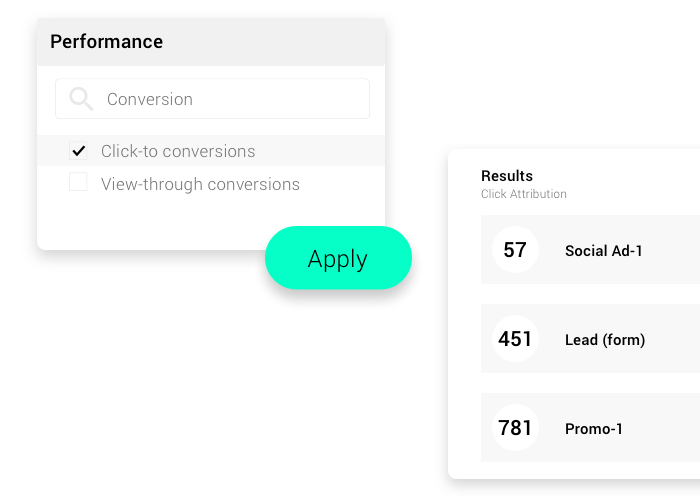
Don’t look at “view-through conversion” metrics.
On a similar note, the next flawed advertising metric is related to what’s called an “attribution” window. This is a time window during which any conversion on your site will be credited back and counted as a conversion on the ad platform.
One of the common default metrics related to attribution is “view-through conversions.” This means it counts when someone sees your ad, doesn’t click it, then eventually decides to convert within a specific time window. The tracking software will take credit for the ad that a consumer “saw” even if they scrolled by it without a second thought.
Here’s a simple way to think of this: Imagine a billboard for a burger restaurant on the side of the highway. Although the driver was focused on the road and may not have seen the billboard at all, the billboard will get the credit for convincing him to go in if/when he decides to go into the restaurant. It could have been that the driver was just hungry or a friend told him to check out the restaurant, but still the billboard takes the credit. Then, the restaurant owners might incorrectly put their resources into more billboards because they believe their advertising strategy is working even if it had little to no effect.
Just because consumers might have seen your ad doesn’t mean they did. Correlation does not determine causation. Therefore, it may be risky to assume users’ intentions through this “view-through conversion” and safer to just simply ignore this kind of metric.
Do look at “click-to conversion” metrics.
View-through conversions are passive, but click-to conversions require someone to actually click on your ad. It’s a much more active process and a much more accurate indicator that the ad impressed a viewer enough to take the desired action.
Don’t forget about date ranges.
Date ranges are another tricky thing to look out for. Each of these ads has a time window. Many platforms give an extremely generous amount of time as the default time window. While many marketers may be ecstatic to see their numbers so high when looking at their click-to conversions, they must keep in mind this increase is due to the default attribution being set to 28 days.
So if a consumer saw your ad almost a month ago, then converted on day 28, the original ad will still take credit.
Many marketers have fallen victim to this misleading data. It’s natural to assume that the rates given represent people who clicked through your ad and converted in the same action, but that’s not the case. It’s actually people who clicked on your ads, then sometime within 28 days decided to convert. It could’ve been a postcard you sent, or an email that sealed the deal, but the ad that person may have seen 28 days ago will get the credit.
This significantly skews your CPA (cost per acquisition) and can cause marketers to favor certain ads that actually had no impact on their sales results.
Do set short date ranges for your ads.
Fortunately, you have the ability to set date ranges on your ads for both Facebook and Google Ads. There’s a conversion window setting where you can alter the default 28 days attribution window and set it yourself.
If you really want to get the fastest, most accurate look at what’s working, set your date range to one day. That will essentially show you the people who clicked on your ad and made a purchase in the same sitting.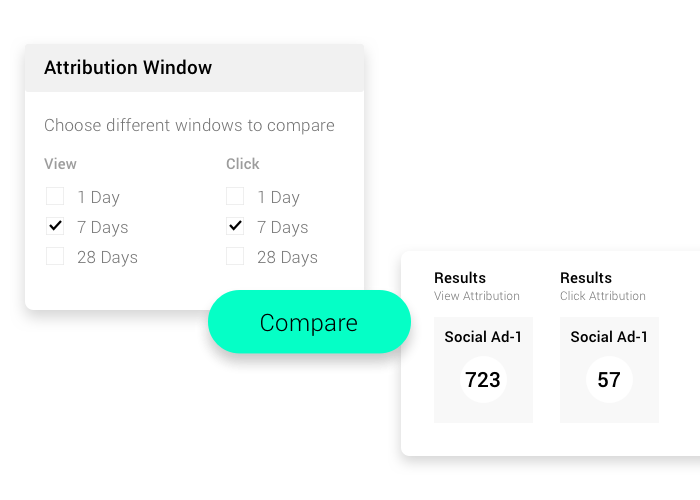
Don’t trust email open rates.
One of the biggest misconceptions in the world of marketing tracking relates to email performance.
The industry standard for tracking email open rate is by a tiny tracking pixel. Your email provider will embed a 1×1 transparent image, or pixel, into the email. Once that image is loaded, it feeds the information back to the provider and they mark it as an “open.”
But there are many problems with this method that lead to completely inaccurate results. First, in order for the image to be loaded, the person receiving emails has to have images turned on. Many inbox providers block images by default, either across the board for all incoming mail or for non-whitelisted addresses.
Also, many people read email on their phone and some email reader apps block images in mobile view.
Lastly, some users block all HTML in their received emails. Instead, they only receive a “plain text email” that doesn’t show images.
This means that some people could be opening your email, but it won’t count as an open because the image didn’t load. This turns your email marketing into a game of chance, depending on who has images blocked or not, and you could end up favoring a certain email that’s actually underperforming.
Do track click-through rates.
Click-through rates (CTR) show the ratio of the number of people who saw your link to the number of people who clicked on it. They’re what tell you if your emails or ads are actually prompting engagement. For example, if you have a catchy subject line, people will probably open your email to see what it’s about, but if they don’t click on any links in your email, the fact that they opened it doesn’t really matter. You want people to click your links as that’s what leads to sales or conversions.
One of the best ways to track all your online marketing efforts and your click-through rates is with UTM variables. UTMs are the industry standard way of tracking traffic from inbound links. They involve appending information to the end of a link URL which tells your tracking platform where the click came from. With UTMs in your email links, you’ll be able to tell if someone clicked on a link from your email as opposed to an ad or other source.