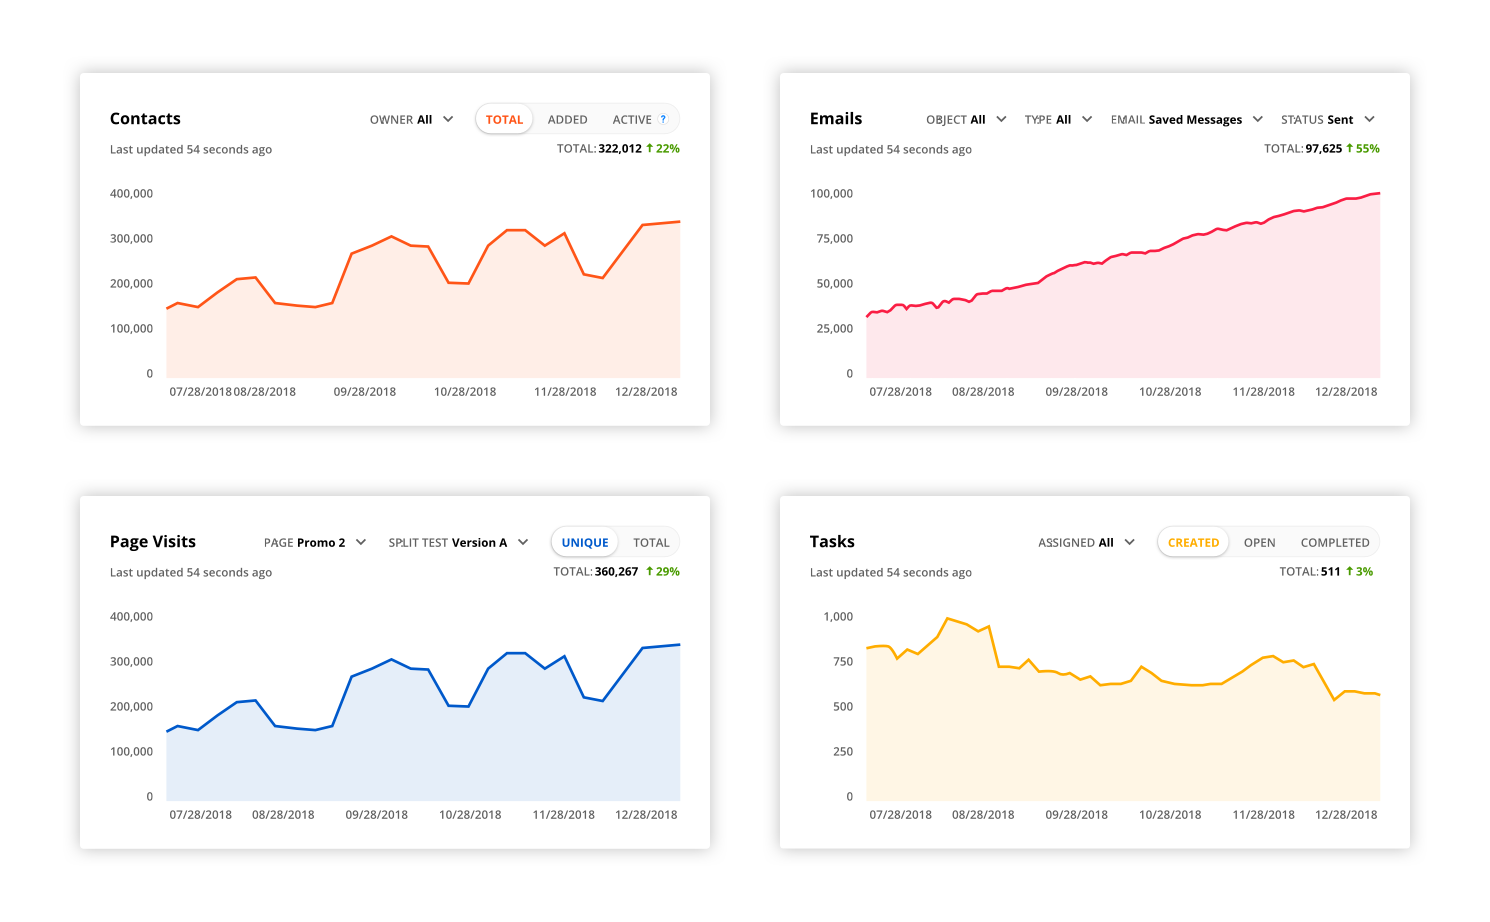
Your new default Dashboard page — Trends — uses line graphs to show you changes in your key business metrics over time.
Just click Dashboard from your navigation bar to check it out! Of course, you still have access to your Metrics page — just click Metrics on the left.

You have charts for:
- Contacts: Track your leads’ and customers’ actions from their very first click.
- Emails: Analyze email engagement, deliverability and campaign performance.
- SMS: Monitor your SMS campaigns and spot deliverability issues.
- Page Visits: See who’s visiting your pages and how each page is performing.
- Sales: Keep an eye on sales and refunds over time.
- Monthly Recurring Revenue: See how much you’re bringing in, and get a sense of what to expect over time.
- Payment Plans: Forecast future revenue, and keep up with customer billing.
- Tasks: Track your team’s productivity so you can better manage future projects.
- Campaigns: Monitor your campaigns to see what’s working and what isn’t.
- Calendar: Track past and future appointments to better manage your team’s schedule.
- Custom Objects: See data related to any custom object you create.
Note, charts that include sales data are not available for Basic accounts.
You can get as specific as you want by filtering any of the charts on your page. You can also customize which charts you want to see and the order you want to see them in!
Learn more here.
Kristen holds a degree in Communication and Liberal Arts from the University of California, Santa Barbara. With five years working as a writing tutor at SBCC and experience as an Ontraport support rep, Kristen now uses both her writing and software expertise in the role of Content Engagement Coordinator. Outside of her time at Ontraport, she is also involved in a variety of creative writing projects.
