The ability to monitor these results in real-time allows you to understand what’s working and what’s not — and even adjust your efforts mid-campaign to influence better results.
Marketing automation platforms like Ontraport make viewing this kind of information possible but, with so much data at your fingertips, it’s important to understand how to interpret it before you make a move.
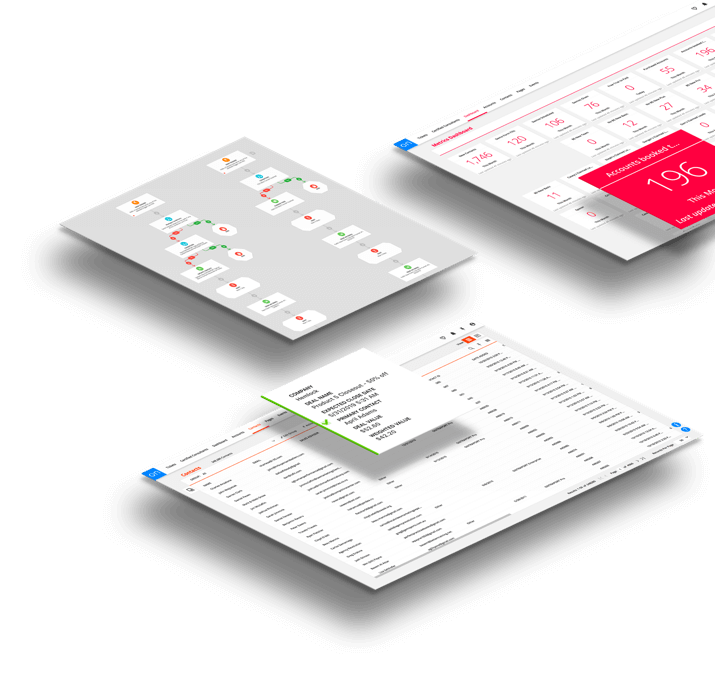
Here, we’ll break down the six performance reports available in Ontraport with tips on how to apply your results to your campaigns. With this data available to you visually on your campaign map, you’re equipped to make faster, smarter decisions to improve your results.
Contact flow reports
One of the most basic reports for getting rapid insight into your campaign’s performance is the contact flow report, which essentially shows how contacts are making their way through your campaign map. Specifically, it shows you how many people are at each element on your map at any given time and how many people have been at each element since you launched.

How to use it
The contact flow report can help you spot areas where leads and contacts are getting stuck. If many contacts are stuck waiting to achieve the same goal, it’s a good indicator that you should either adjust your campaign to better motivate them to take action or change your goal.
You can also use the contact flow report to easily find segments of your contacts to specifically market to. For example, you can click on the contact flow statistic on any element to view a list of those stuck contacts. Then, you can send an email or perform any specific task with that group.
Funnel conversion reports
Just as you’d measure the conversion rate for an ad or a landing page, in Ontraport you can measure the conversion rate for each goal within your campaign. Everything leading to a goal on your map is effectively a funnel, so your conversion report tells you how well you’re moving contacts through your funnel to reach your goals.

How to use it
Look for goals that have unusually low or high conversion rates — what steps on the map leading up to those goals might be influencing the conversions?
Another thing to pay attention to is how poor conversion rates on early campaign goals might be negatively affecting later-stage goals. Say that you have a campaign with 100 people on it. Your campaign is telling people to sign up for your free online course then sending an offer for a discount on your main product to everyone who responded. Let’s say that only five people achieved your first goal, signing up for your course. That’s a 5% conversion rate — not so great. Then, let’s say that one person buys your main product. Out of your entire campaign audience of 100, that’s a 1% conversion rate. To fix it, you could work on improving your offer, but even if that offer converted at 100%, if only five people saw it, you’d still never get enough sales to justify your time and effort.
But the conversion rate for people who actually saw the offer for your main product is great — five people saw it and one converted, which means you had a 20% conversion rate. If that rate can stay the same as you increase the number of people who move to that step in the funnel, you’ll be able to sell far more. To fix this problem, focus on promoting your free online course offer to increase the number of people who respond. Then, you can convert more people later on in your funnel.
Lifetime value reports
Knowing the lifetime value of your leads — the total amount they contribute to your bottom line over time — is one of the most important metrics a marketer needs. Without this information, it’s impossible to know how much you can profitably spend to acquire a new customer.
In Ontraport, the lifetime value report shows the total and average amount spent by the contacts who hit any element. This includes money that they’ve spent on any product throughout their entire relationship with your brand since they entered your database. You can compare how lifetime value grows over time for each step on the map and understand which pieces of your campaign have the greatest overall impact on revenue.
How to use it
Understanding the lifetime value of your campaigns can help you make better decisions about your marketing budget. For example, if you know that it typically costs $15 to acquire a new contact, you might wonder if you’re overpaying. It seems expensive, but what if you also knew that, on average, contacts on your campaign spend $30? With that piece of the puzzle, you know that investing $15 to acquire a new contact is a smart move that will earn you money.
You can also compare how the lifetime value changes for different segments of your audience. For example, you can filter your report by lead source to compare the lifetime value of leads from Facebook to leads from LinkedIn. Understanding lifetime value on a channel-by-channel basis is incredibly valuable when making decisions about which channels to increase your spending on and which channels to cut back on. For example, if you know that customers from Facebook have a far higher lifetime value than LinkedIn customers, you can increase your Facebook advertising budget and decrease your LinkedIn budget.
Goal conversion rate reports
With a goal conversion rate report, you can find out what percentage of contacts at each point on your campaign will achieve a selected goal based on past data. For each element on your map, you can see the total number and percentage of contacts who hit that step and eventually went on to achieve the goal.
How to use it
Being able to view this for each campaign element gives you the insight to understand how each piece contributes to the results of the whole. You’ll be able to understand the impact each individual email message, task, goal or condition had on the campaign’s overall conversion. For example, this report could show you what percentage of the contacts who opened an email ended up purchasing a product.
Goal conversion time reports
A goal conversion time report reveals how long it took contacts to achieve a selected goal from the time they entered your campaign. This can be any goal, not just purchases. You can measure how long it took them to do anything — open an email, fill out a survey, join your referral program, sign up for a free trial, or complete any other goal you’ve created on your campaign map.

How to use it
Knowing how long it takes contacts in your funnel to take action allows you to plan ahead and set better time-bound goals for your growth. It can also help you identify opportunities to push contacts through your funnels faster if it is taking too long for them to take the next step.
Goal conversion time reporting also comes in handy for managing your campaign promotion budget. By determining when you can expect new leads to convert, you’ll better understand how long your payback period might be from a campaign.
This report is also useful when deciding how to allocate your marketing budget to focus on the sources that convert fastest. Just as with other reports, you can filter your goal conversion time report by lead source to compare and contrast the behavior of leads from each different marketing channel. You might find that, although there’s no difference in lifetime value or even goal conversion rate, leads from different sources achieve the goal at different rates. This helps you decide which marketing channels to focus on for the fastest growth.
However, if your lifetime value is particularly high for one group of leads who also take a very long time to reach your set goals, it is probably worthwhile to continue investing in that source. With an understanding of how long it will take them to achieve the goal, you won’t have to worry about leads from that channel underperforming. Since you know that it’s just going to take them some time, you can simply wait for them to pay off instead of killing that lead source.
Goal conversion point reports
The final type of goal conversion report is the goal conversion point report. With this report, you can see exactly where contacts were on your map when they achieved the goal you select. Although it may seem similar to a goal conversion rate report, the advantage of this type of report is the ability to see exactly which elements on your map are the most effective at driving conversions.
Rather than merely understanding how likely it is that contacts on each element will convert, with a goal conversion report you can see a breakdown of where all the contacts who achieved the goal were on the map when they achieved it. This can make it even easier to understand which aspects of your campaign are the most effective for motivating leads and contacts to take action.
How to use it
One reason you might use this report is to get a better understanding of which emails in a long nurture sequence were the most effective at converting cold leads back into warm ones.
Let’s say that the goal you have for disengaged contacts is for them to fill out a form to earn a promo code they can use later. This lets you know that they’re now warm prospects again. If you added this group to a long-term lead nurturing sequence that sends them a series of emails each week for several months, you may want to understand which email is the most effective at motivating them to re-engage. A goal conversion point report would show you where contacts who filled out the promo code request form were on the map right before they took action, giving you a breakdown of which emails were the most effective.