The scope of what’s possible with marketing tracking is ever-growing — there are constantly new tools coming out that allow you to gain insight into a new area of customer behavior that you didn’t have access to before. One of the easiest ways to track at every stage of the customer lifecycle is through use of UTMs. But, as with any large project, starting by completing one small step at a time is key to getting the momentum going and eventually getting it done.
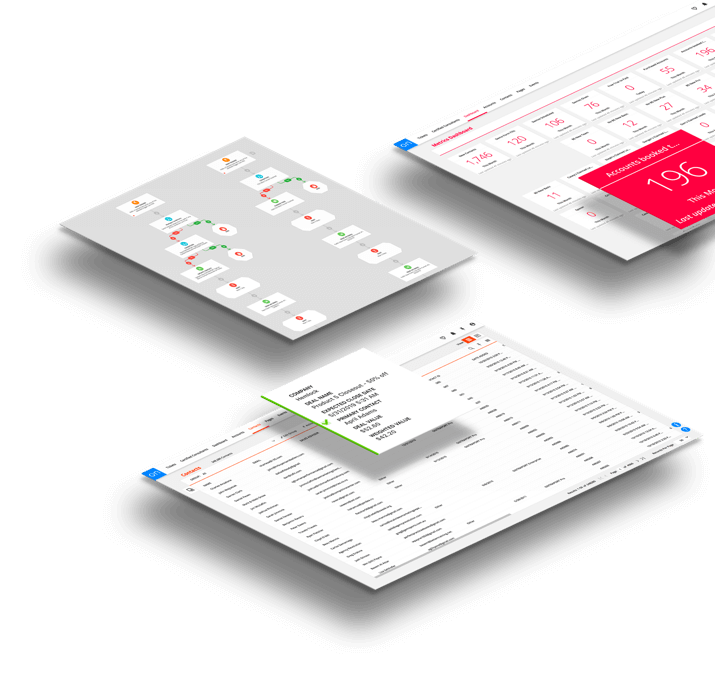
We recommend looking at your marketing analytics in terms of the customer lifecycle. When you break up your marketing data into five separate stages — Attract, Convert, Fulfill, Delight and Refer — you’ll have a framework to better manage the data and use it to nurture leads and customers from one stage to the next.
Below, you’ll learn about how the strength of your relationships with each lead and customer should influence the types of data you pull and where you pull it from.
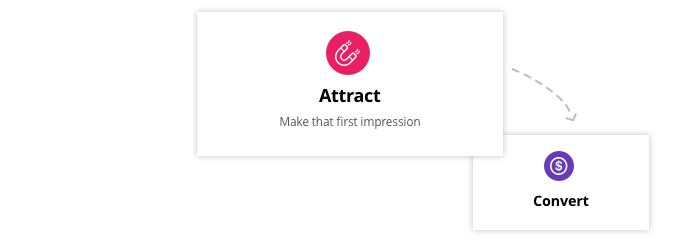
Stage 1: Attract
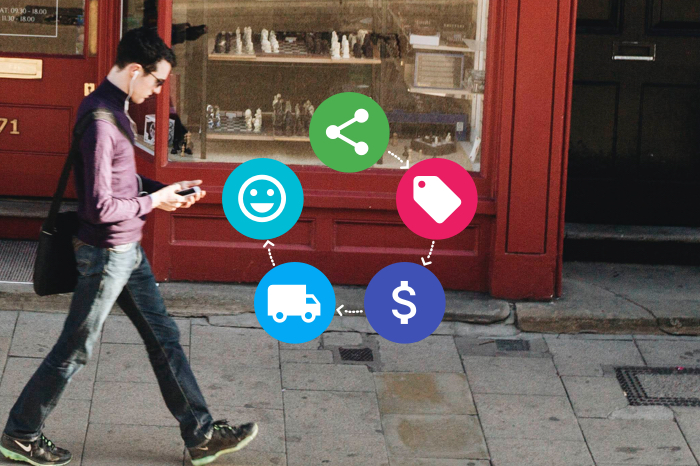
During the Attract stage, you’re working to initiate some form of relationship by making prospects aware of your brand. This stage is all about making that first impression by introducing yourself and working to earn your new leads’ contact information so you can keep in touch.
At this point, your audiences are cold — meaning these people are nameless (not in your CRM database), and you’re trying to do two things:
- “Cookie” them so that even if they don’t opt in for anything or give you their contact information, you can at least retarget them.
- Get them to fill out a form with their contact information so that you can begin reaching them via email or phone call.
To attract new leads to your brand, running Facebook and Instagram ads using interest- and demographic-based targeted audiences can help match with your brand’s ideal customers.
Stats to track in the Attract stage
Because ads are such an integral part of this stage, many of the data points you’ll review will relate to the interactions people have with your ads. To gauge the success of your ads, you can see if people are clicking on them and how long they stay on the page once they do. If people are rarely clicking, and the ones who do are expensive and close the page right away, it might be time to make tweaks to your audience, copy or design.
After months of running your Attract campaigns, use your tracked UTM data to look back at how many of your existing customers first came in contact with your brand through each awareness ad. To keep track of it all, here are the stats you’ll want to look at:
- Click-through rate (CTR)
- Cost per click (CPC)
- Average time on page
- ROI and first-click attribution

Stage 2: Convert
The Convert stage of the customer lifecycle is all about turning your warm-to-hot leads into customers. Now that these leads are on your list, you know exactly who they are and where they came from because of UTMs. You’ve already begun to build a relationship with them, so your goal now is to get them to purchase from you, which you can encourage in a few different ways:
- Email offer funnels (with links tracked by UTMs)
- Retargeting ads that use the cookies you placed on leads’ browsers in the Attract stage to offer your product to them on Facebook or Google
Stats to track in the Convert stage
When you’re tracking your conversion success with UTMs, it’s important to first establish your end goal. A conversion doesn’t have to mean a paid purchase — it can be a sign-up for a demo, an entry-level product sale, or even an opt-in for a free trial — but whatever it means to you, base your metrics tracking on that.
The main way you’ll keep track of campaign conversions is by looking at your UTMs in Google Analytics. Here’s what you will look for:
- Conversions or sign-ups
- Number of opportunities
- Conversion rate
- Number of conversions
- Impressions or views
- Click-through rate (CTR)
- Cost per acquisition (CPA)
- ROI

Stage 3: Fulfill
Now that your leads are customers, it’s time to deliver on your promises and wow them. This is where you add more value, ensure your customers’ success with your product, and instill confidence in their choice to buy from you.
Delivering an incredible customer experience is critical for retention, so the more value you pack into their experience at this stage, the better.
Stats to track in the Fulfill stage
The value you create for your customers means nothing if they’re unaware of it. In this stage, your goal is to keep track of how well your customers are engaging with your products and services. If you deliver an online product or service, have they set it up? If you provide complimentary setup calls or visits, how many customers are taking advantage of them, and how much time passes by before they schedule the setup?
Here are some of the stats to look for when measuring whether your customers are maximizing their experience:
- Usage
- Email unsubscribes
- Customer satisfaction
- Customer lifetime value (CLV)
- Open rate on delivery and bonus emails
- Click-through rate for bonus content
- Conversion rate for onboarding calls or tutorial video views
- Conversion time
- Bounce/spam rate

Stage 4: Delight
Once the initial excitement wears off with your brand, the Delight stage is where you go the extra mile to maintain the positive relationship. Here, you’re working to strengthen your customer bonds into long-term relationships and prime them to refer more business to you. It’s an opportunity to share upsell and cross-sell offers with existing customers and to remind them why they picked your brand in the first place.
According to Astute Solutions, “Attracting a new customer is six to seven times more expensive than keeping an existing one,” so if a customer has made it all the way to the Delight stage, it’s incredibly valuable for your business to keep them coming back. By looking back at your source UTMs you can custom tailor content for all of your customers in the delight phase?
Stats to track in the Delight stage
Determining your success in the Delight stage is all about tracking conversions on upsells, cross-sells and higher-end products. If you offer a tiered online product, are you keeping track of which customers are upgrading? For both online and physical products and services, have they recently purchased more items from you?
Additional ways to gain insight into the strength of your relationships with customers is how often they buy from you. Are they once-a-year buyers or weekly? Depending on your industry, the expected purchasing frequency will vary. Here are some of the stats you can use to keep track of how delighted your existing customers are with your brand:
- Upsell and cross-sell conversions
- Repeat customer rate
- Purchasing frequency

Stage 5: Refer
If you’ve played your cards right in each stage of the lifecycle, you’ll reap your ultimate reward in the Refer stage. The greatest value you receive from your customers comes not from their initial purchase or even their upsell purchase, but from the new customers they refer to you.
Referrals are especially important for growing your brand because your existing customers are likely already recommending your products and services to right-match prospects. According to InMoment, “75 percent of loyal customers will recommend a brand to friends and family.”
Stats to track in the Refer stage
Effectively keeping track of your referrals is a win-win for both you and the customers. When you know what to track, you not only learn more about what types of customers grow to eventually become strong referrers, but your referrers also get the proper credit and payment for their work. Here are some of the stats to track in the Refer stage:
- First-click attribution on affiliate links
- Number of purchases from referrals
- Participation rate
- Affiliate link impressions
- Marketing UTMs