Welcome to Customer Insights, where one of our experts meets with an ONTRAPORT user to answer his or her questions about strategy, how-to, design and automation techniques. The conversation is streamed live in the ONTRAPORT User Community on Facebook for all our users to learn from. Check out the recap and video clips here in case you missed them. Our first guest is Andrea Featherstone, founder of Project Self, who joined ONTRAPORT’s Campaign Director Sam Flegal. In an hour they went over email performance best practices, tracking repeat clients, and finding out which of her marketing efforts were working best.
Email Performance: Where to Look
Setting up an email campaign is one thing, but how do you correctly set it up to also view email engagement? When Andrea asked this question she was asking about email opens, sends and clicks. To view this data and build the campaign, we looked at the messages collection and Performance Mode.
Performance Mode shows you an overlay of data directly on your campaign map. To see email engagement metrics from the campaign view there’s a little more set-up work involved. You’ll need to build in “goal” elements with specific settings.
Setting Up Goals Correctly 
A goal allows you to see who has taken a specific action. In this case the action is opening an email or clicking on a link within an email. While setting up the goal to show this data, Sam went over the importance of goal settings.
In every goal you set up, you will see a menu populate on the left of the screen. Within this menu you have two questions:
- Who can achieve this goal
- If the contact is already on the map, then…
Anytime you are utilizing a goal for anything, you want to make sure you are setting these menu options up correctly.
In Andrea’s case, she wants to know how many times an email is opened, so under “Who can achieve this goal” she would choose “any contact in account.” By choosing these settings, she ensures that her numbers are not restricted to only those people on this map or on the previous step and that she will capture anyone who opens the email again later.
Similarly, for the “if the contact is already on the map” selection, she would want to have them “added here again” to capture the data. Selecting these options guarantees that contacts will be added to this goal with numbers updating appropriately, while also continuing on the other paths they are on within the campaign.
A best practice is to use a fork prior to the goal. A fork sends contacts down two paths at once, which means you can separate your actions and reporting into two clear paths. One path includes any further automation, such as email sends, tags and tasks, while the other path has only the engagement goal outlined above. Goals that are created within one path prevent contacts from progressing to these next steps until they have achieved the goal (in this case, until they have opened the email).
To learn more about goals, check out this knowledge base article.
Tracking Repeat Buyers
Who is buying multiple items from your brand and what do they buy first? The transaction log will show you this data. Much like the messages collection, the spreadsheet view allows you to see who bought what and when, by each transaction. If your business has thousands of products and buyers, consider creating a campaign to clearly report on this data by creating what our team calls a reporting campaign.
To set up this map, you start with a trigger of a product purchase for each product you sell. You will have a line of triggers at the top of your map, one for each product. Within each trigger you’ll dictate the settings to be “any contact in account,” and “add here again.” Then below each trigger, you will add every other product using goals. Use the goal of “purchases product” with the settings “contacts on any upstream element” and “add here again.” Continue doing this for each of your products. The idea of this map is not only to find repeat buyers but also see trends in buying habits.
To see more about the transaction log, check out this knowledge base article.
Finding out Which Marketing Efforts Are Working
How do I know which of my ads are working? To find out which of your marketing efforts are working, we must first explore UTM parameters, which add text to your URLs so that you can track the traffic from each ad or other lead source. You can set up these links from within an ONTRAPORT Pro account or higher, or use any google UTM builder. Either way, ONTRAPORT will automatically capture these variables and place them within the contact record.
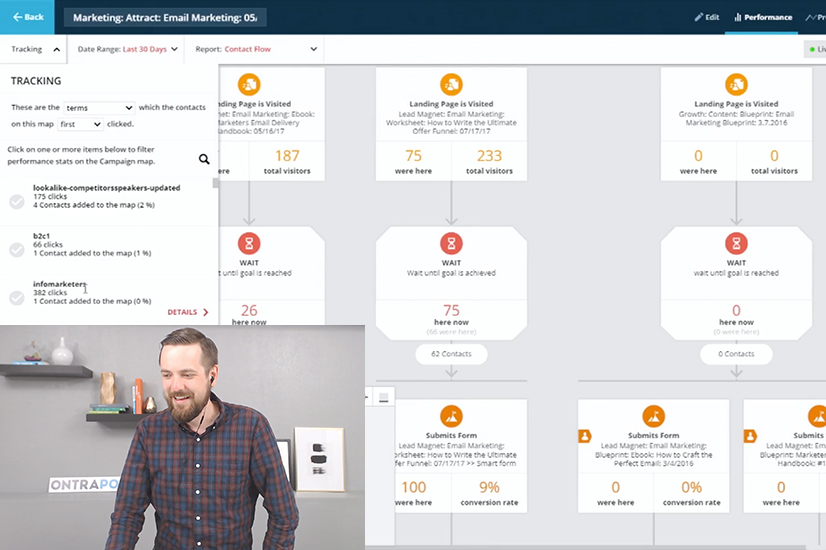
Once this is done our system will capture the data necessary to answer the overarching question about which marketing efforts are working. You can view this data within Performance Mode by clicking on Tracking. From there you will be able to click between different elements and lead sources and watch as the numbers change on the map. You could click on your Facebook ad and see that it might bring the most leads into your account but has the lowest conversion rate, whereas Instagram brings in fewer leads but of higher quality.
You can also create groups based around the different variables from within the contacts collection. Much like the examples above, this will give you a spreadsheet view of the contacts. The benefit of doing it this way is you are able to drill down into the contact directly from this screen and answer questions such as what else are these contacts clicking on, downloading or visiting?
To learn more about UTM’s check out this usecase.
Want to be featured on Customer Insights?
Sign up and submit your question to be featured here.