The Deals app provides an organized and interactive pipeline that shows all deals and their stages.
In this app, you'll get deal records to hold information about each deal. The app’s Card View shows you the most important information about each deal, and you can update your deals by dragging cards to different columns.
By visualizing deals in the pipeline by stage, you and your team can easily see the progress of your sales funnel. This lets you quickly identify deals likely to close soon, new opportunities, and high-value prospects. These insights empower your team to prioritize tasks to focus on the deals that will drive sales growth.
When you enable the Deals app with the Companies object, the prebuilt relationships allow you to connect your deals with the companies they are associated with. Check out this article to learn more.
Table of contents
What are Deal records?
Deal automations
• Calculate weighted value
• Update expected deal timeframe
• Update actual close date
• Set deal size color field
• Time since last activity color field
• Update expected deal timeframe
Get started
App record and field reference
What are Deal records?
Deal records help sales teams track the process and value of the sales pipeline. They include essential fields like Deal Value, Expected Win %, and the automatically calculated Weighted Deal Value. Each record also links to a primary contact and the associated company.
Because deal records connect to contact and company records, you can view all conversations, emails, and activities for each deal in one place. You’ll know exactly who you are selling to and what business they represent while avoiding duplicate work when multiple deals involve the same company.
Deal automations
Back to top
The Deals app includes automation maps that calculate deal information, keep your pipeline updated, and update deal records. Learn about each map and its purpose below.
Calculate weighted value
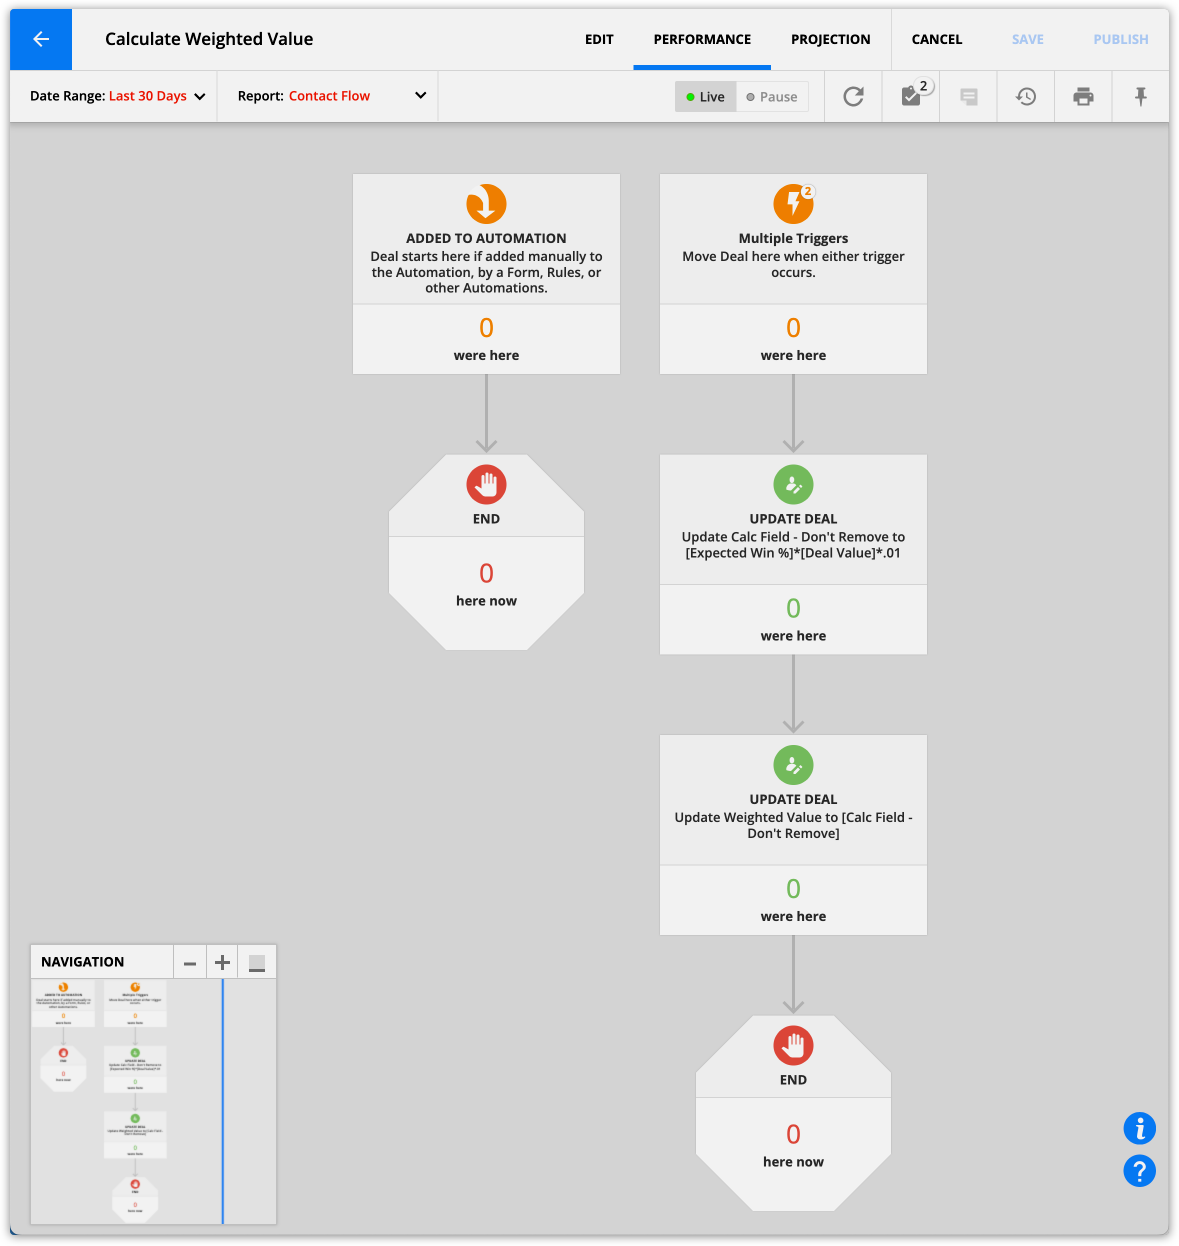
This automation map does the math to calculate your deals’ weighted values. Check out the “Field reference” section below to learn how to use your deals’ weighted values to forecast your monthly or yearly revenue.
Update expected deal timeframe
Back to top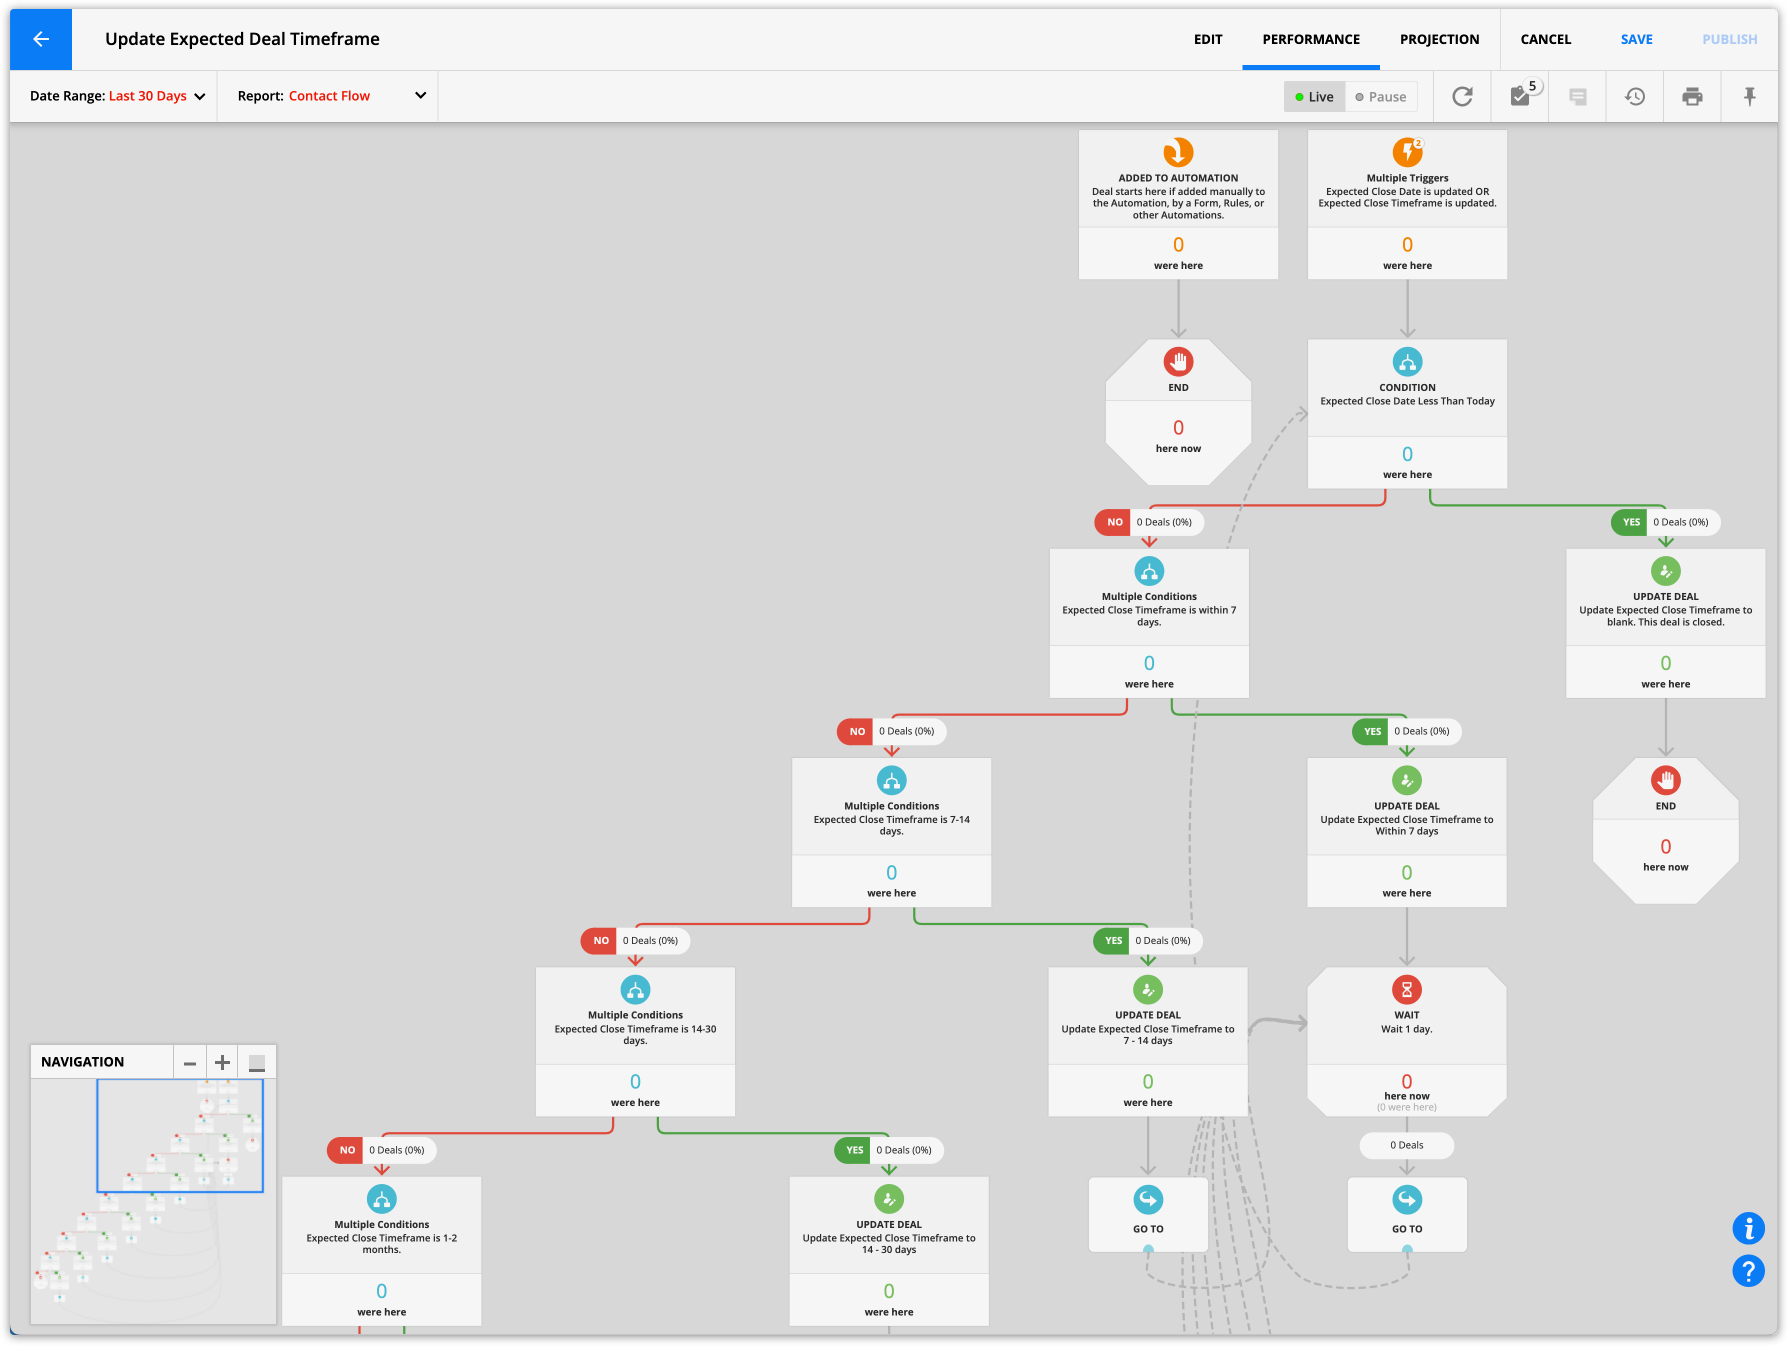
This automation continually updates the close timeframe to give team members ongoing estimates of when they can expect a deal to close.
Update actual close date
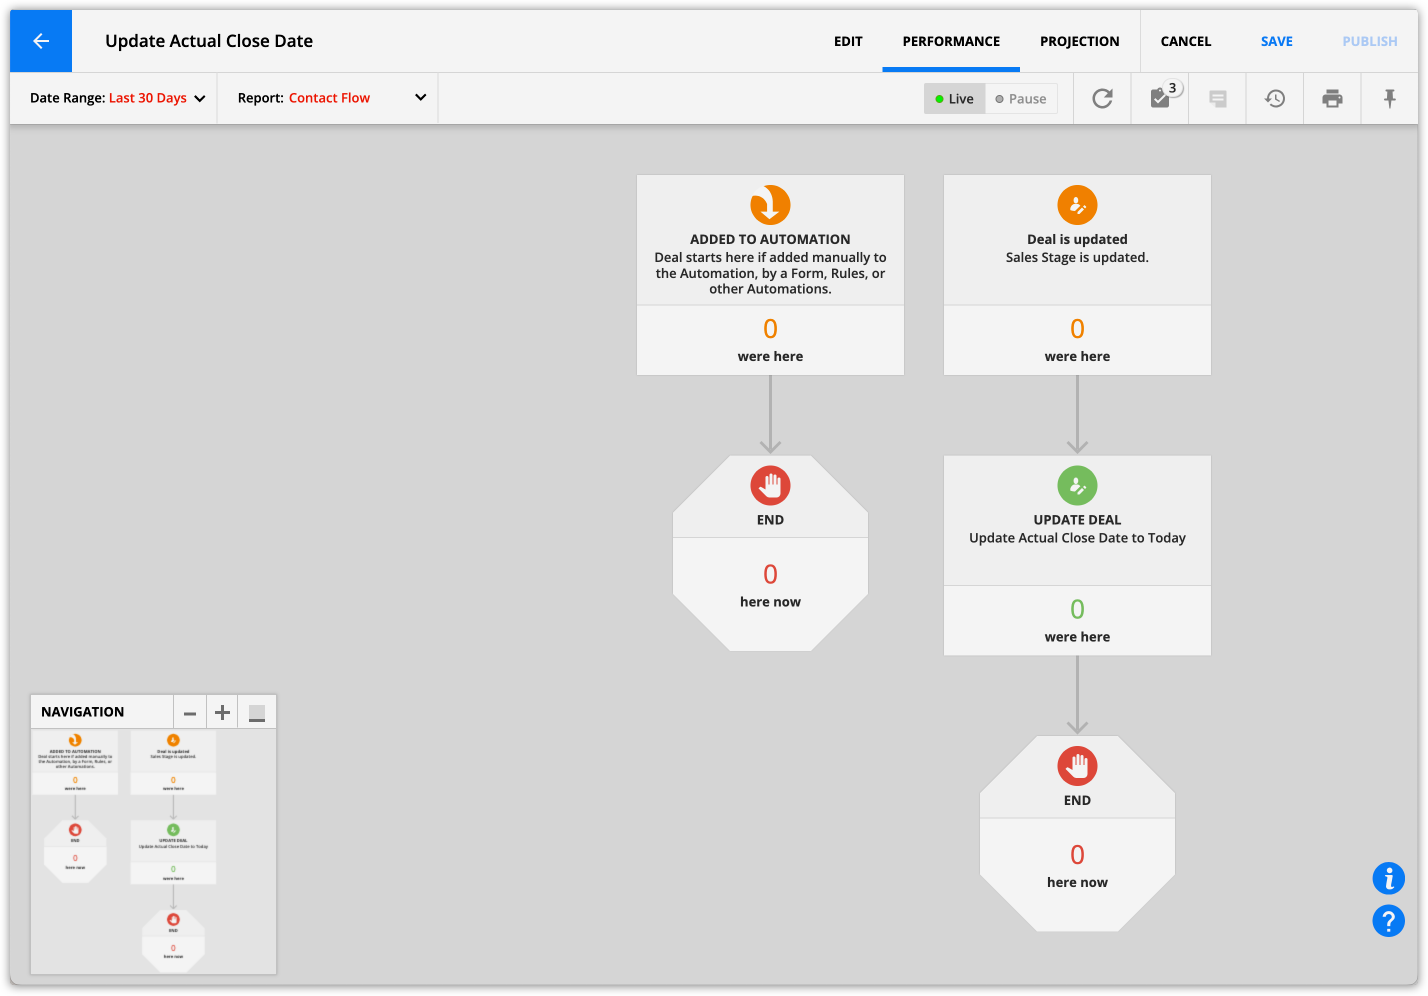
This automation adds the deal’s close date once you move it to the Closed stage of the pipeline.
Set deal size color field
Back to top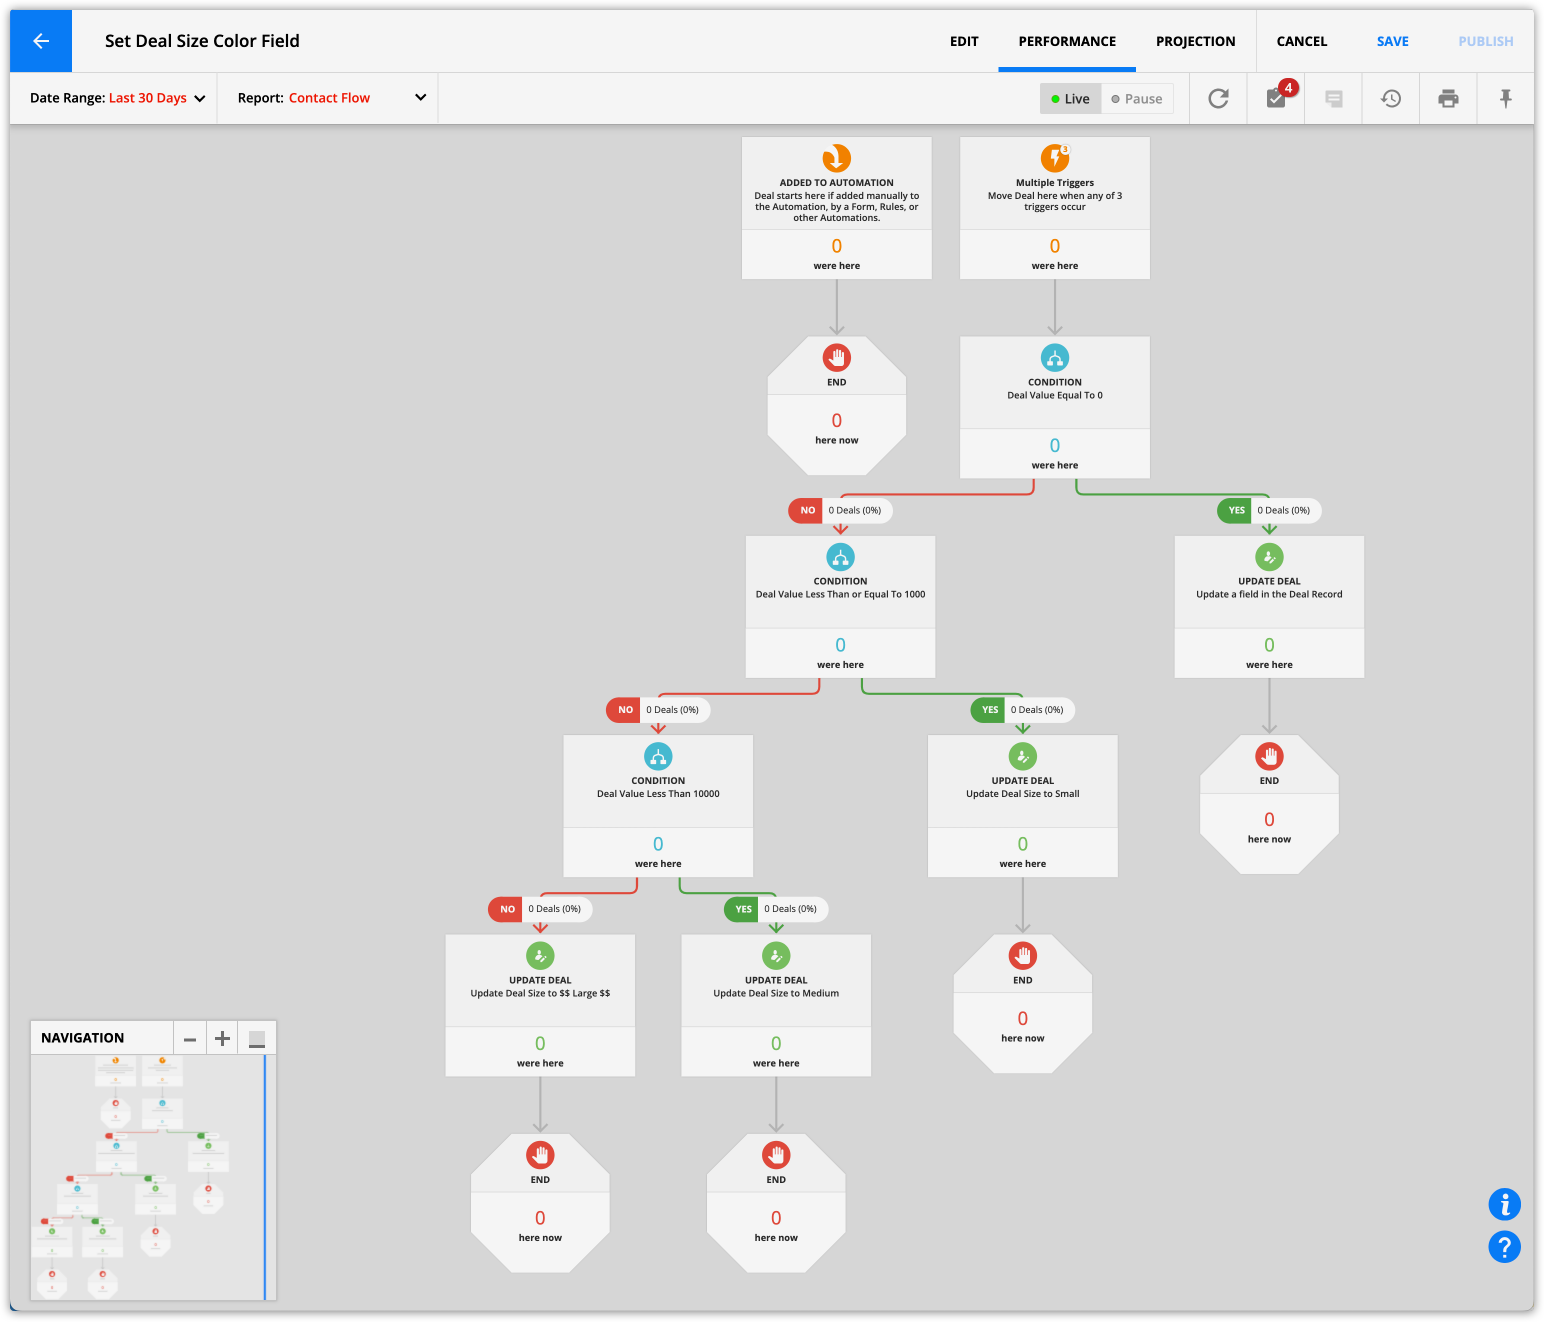
This automation assigns colors to cards corresponding with deal sizes so team members can quickly see the deal's monetary value. This information allows reps to instantly zero in on deals that are the hottest, biggest or highest priority.
Time since last activity color field
Back to top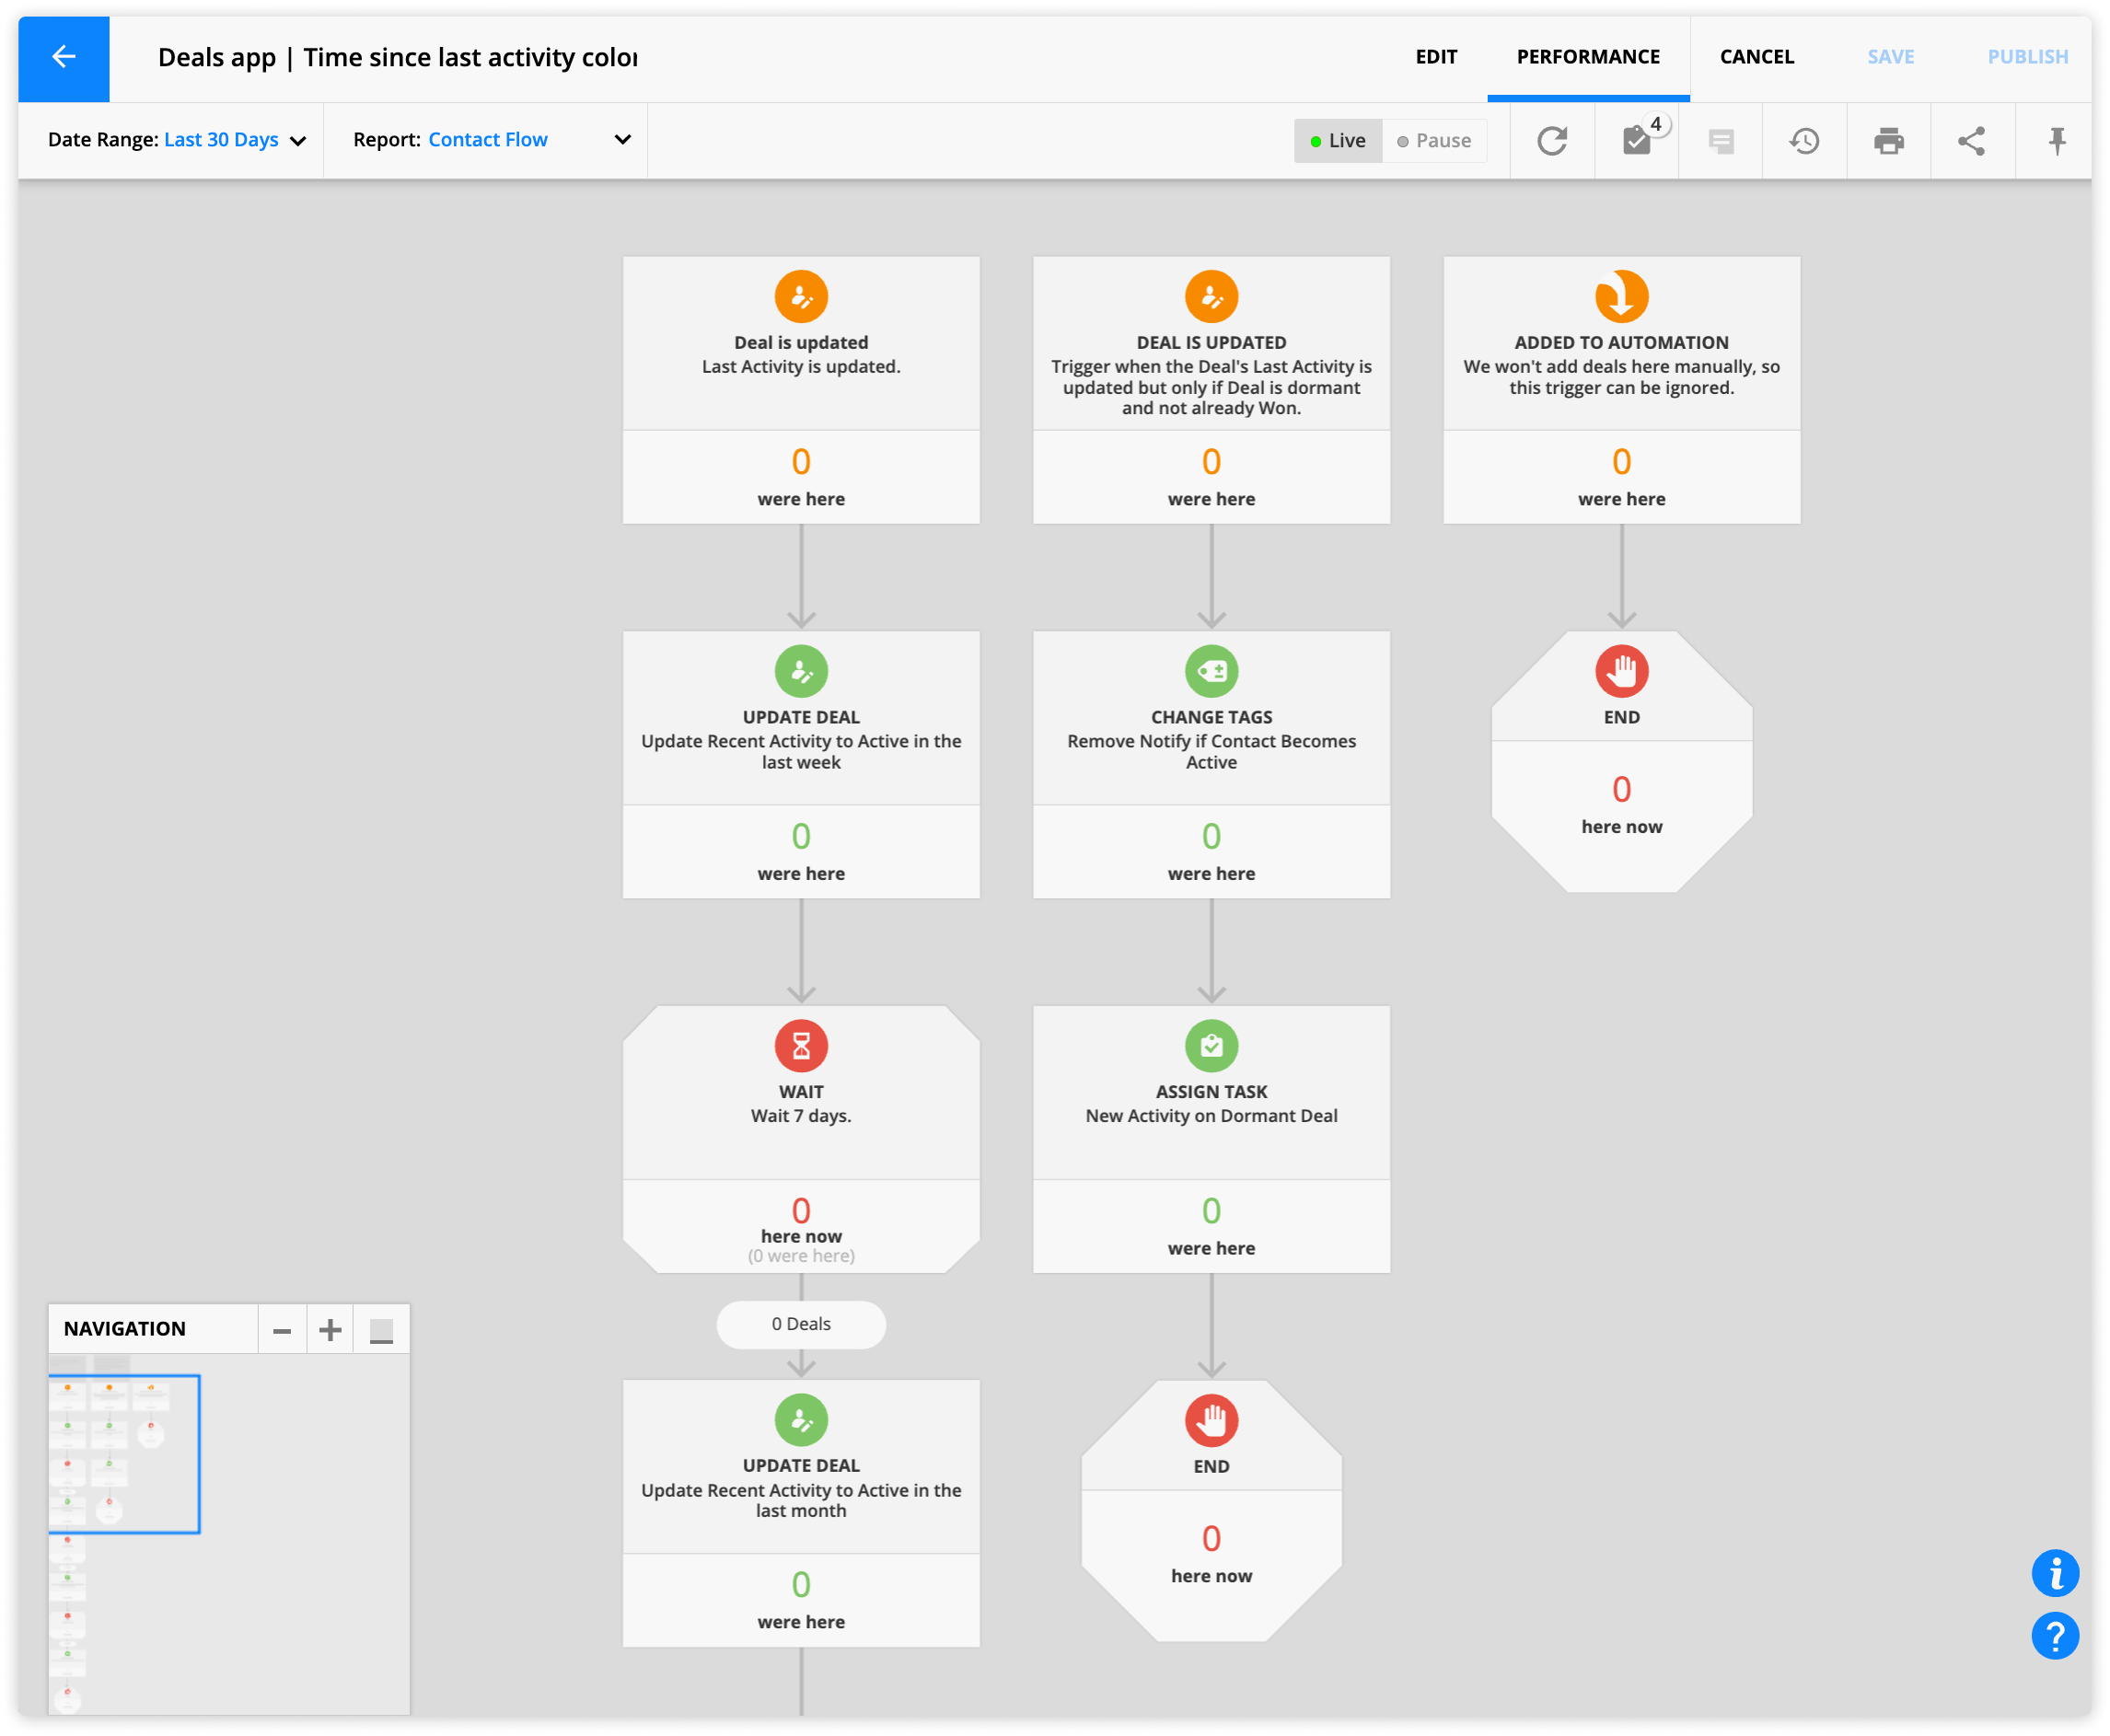
This automation assigns a color to cards corresponding to the deals’ activity so team members can quickly see which deals are inactive. This automation map uses the “Last activity” field in the deal records, which is updated when primary contacts or related contacts send you emails, visit pages or otherwise interact with your business. The map marks deals with no activity for 45 days as inactive.
If the inactive deal becomes active again, this map assigns the “New activity on dormant deal” task to a team member to check in to see if they can save the deal.
Update expected deal timeframe
Back to top
This automation assigns a color to your Card View corresponding to the deal’s expected close timeframe. This allows your team to quickly see which of their deals are expected to close soon and focus on closing the deals that are most pressing.
Get started
Back to top
Here are the steps to get started with the Deals app.
Step 1: Create deal records
This app does not include default deal records because they are connected to account users. We do not automatically add new users to your account.
Therefore, you’ll have the best experience viewing the deal pipeline and internal stats pages if you save some deal records first.
- Go to your Deals collection.
- Click New deal and fill in all the fields in the “Deal information” section.
- (Optional) Add related contacts by clicking New related contact in the “Related contacts” subcollection.
- Select existing contacts from the “Contact” dropdown.
- Or click New contact to create a new record.
- Click Save.
- Repeat steps 1-5 until you’ve added all the deals in your pipeline.
Step 2: View and manage your pipeline in Card View
You can view your pipeline once you’ve added deals to your account. It’s easy to update your deal’s status using Card View and switch the field to display as columns to gain further insights.
If you are unfamiliar with Card View settings, check out this Ontraport University lesson.
You can use any of the following fields as columns for your Deal Card View:
Sales stage
If you have the sales stage fields displaying as columns in your Card View, you can view all your deals organized by their sales stage. If you or your team jump on a call with the primary contact and determine that your new prospect is a sales qualified lead (SQL), you can easily drag the card from the “New prospect” column to the “Qualified lead” column to update the sales stage field of your deal.
Recent activity
When you select Recent activity as the field to display as columns, you gain a powerful tool to stay on top of your deals. You’ll be able to see at a glance which of your deals are falling into inactivity, prompting you to reach out and get them back on track.
Check out the “Field reference” section below to learn more.
Expected close timeframe
When you select this field to display as columns, you can see your deals organized by the timeframe you expect them to close. This view helps your team identify the deals close to closing so you can pay special attention to them.
Deal size
When you select this field to display as a column, you can easily see the deals with the greatest monetary value.
Check out the “Field reference” section below to learn more.
Step 3: Monitor your results
Once your system is running, you can monitor its performance with these groups.
Active deals
This group shows you all the active deals in your pipeline. It opens in Card View and uses the Sales Stage field as a column so you can see where each of your deals is.
Deals won — Last 7 days
This group shows you all of the deals you won last week. This Card View uses the “Deal size” color field to show the size of the deals you and your team have recently won.
Expected to close soon
This group shows you all the deals whose expected close date is within two weeks. The Card View uses the “Sales Stage” field as columns so you can see if your deals are moving towards a close at the rate you expected them to.
New deals — Last 7 days
This group shows you all the deals created in the last week. The Card View uses the “Sales Stage” field as columns to see how your new deals are progressing through the stages of your sales cycle.
New deals today
Similar to the “New deals — Last 7 days,” this group shows you all of the deals created today. The Card View also uses the “Sales Stage” field as columns so you can see where each of your new deals is in your pipeline.
Expected close dates
This group shows you all the deals with an expected close date saved in the record. It uses the “Expected Close Timeframe” field as columns to see when you expect all of your deals to close.
Sort by deal size
This group shows you all the deals with a value saved in their records. It uses the “Expected Close Timeframe” field as columns and also has the “Deal Size” color field selected to display on the left of the card. This group helps you see at a glance which of your deals are high-value.
App record and field reference
Back to top
Here’s some important information about the app.
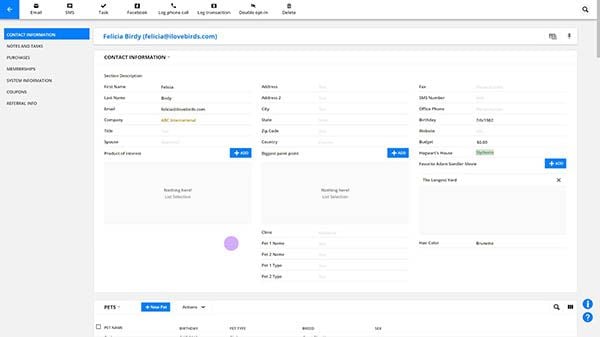
Deal records
Your deal records contain all the information about your pipeline deals. This data includes crucial information such as the Deal’s name, sales stage, value and more.
Here’s a description of essential sections in your record and the fields stored there:
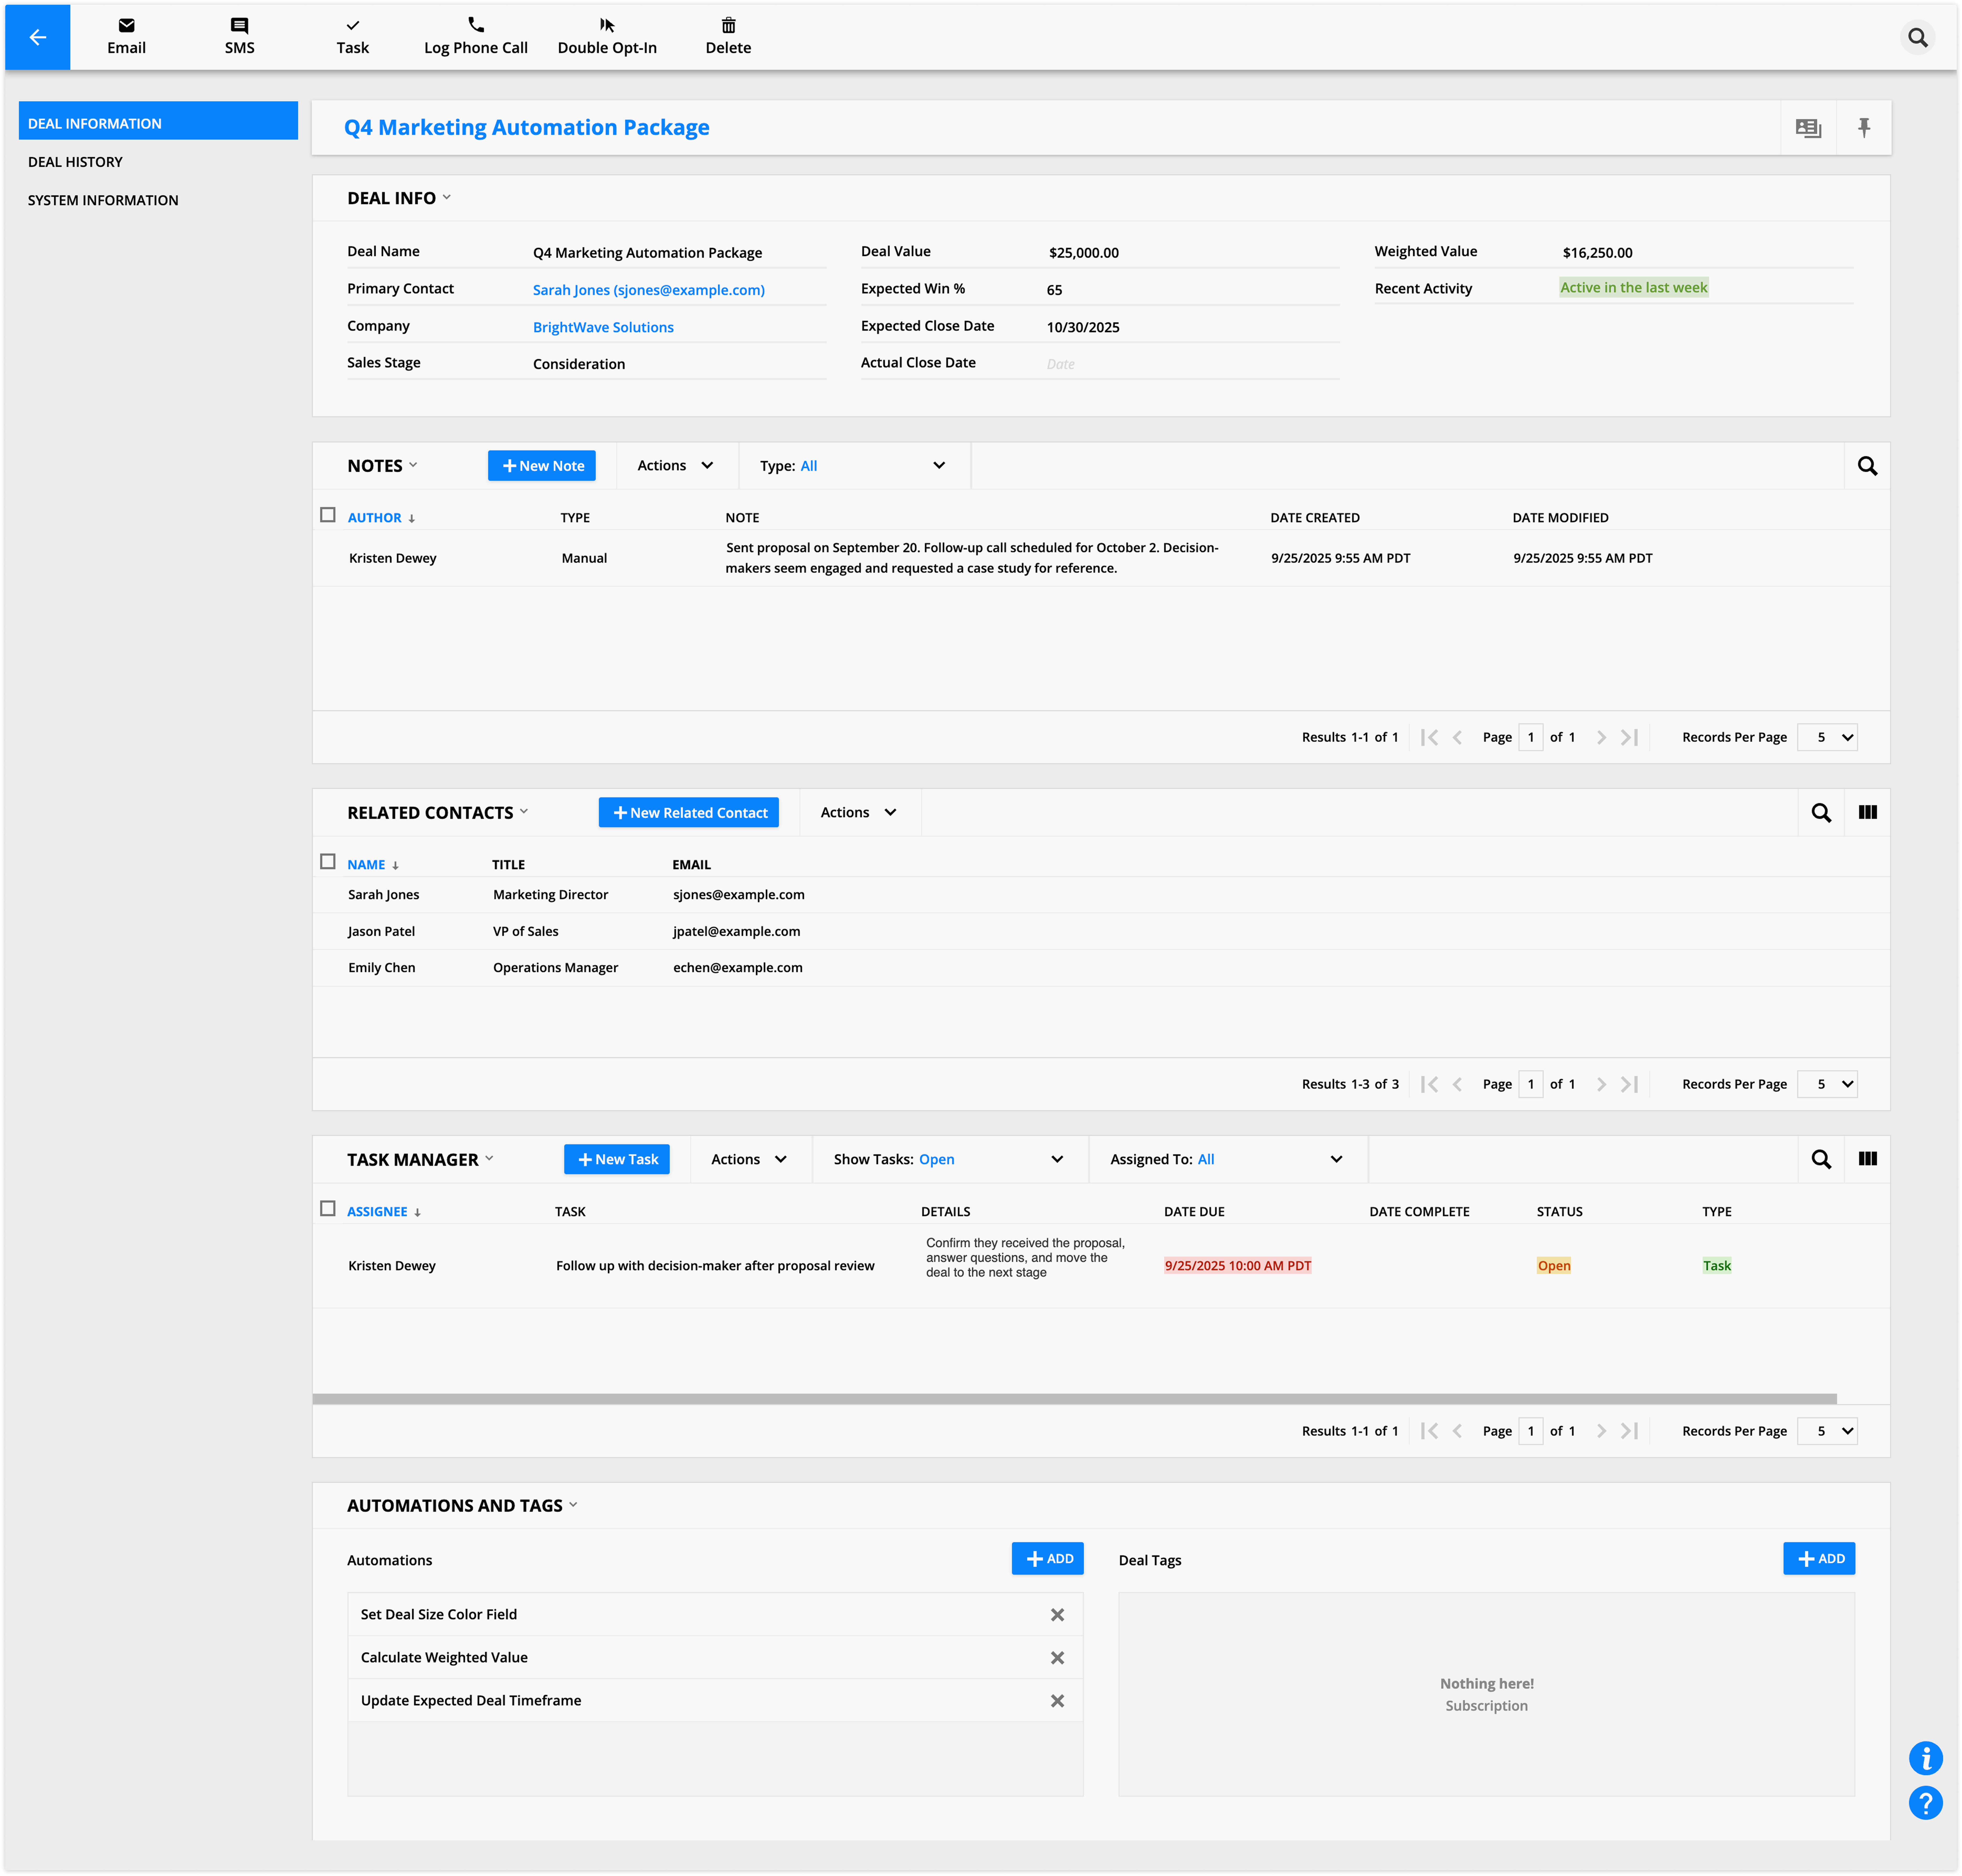
Deal information section
The “Deal information” section contains the fields you’ll add info to when you create a new deal so you can track it and work towards winning the sale.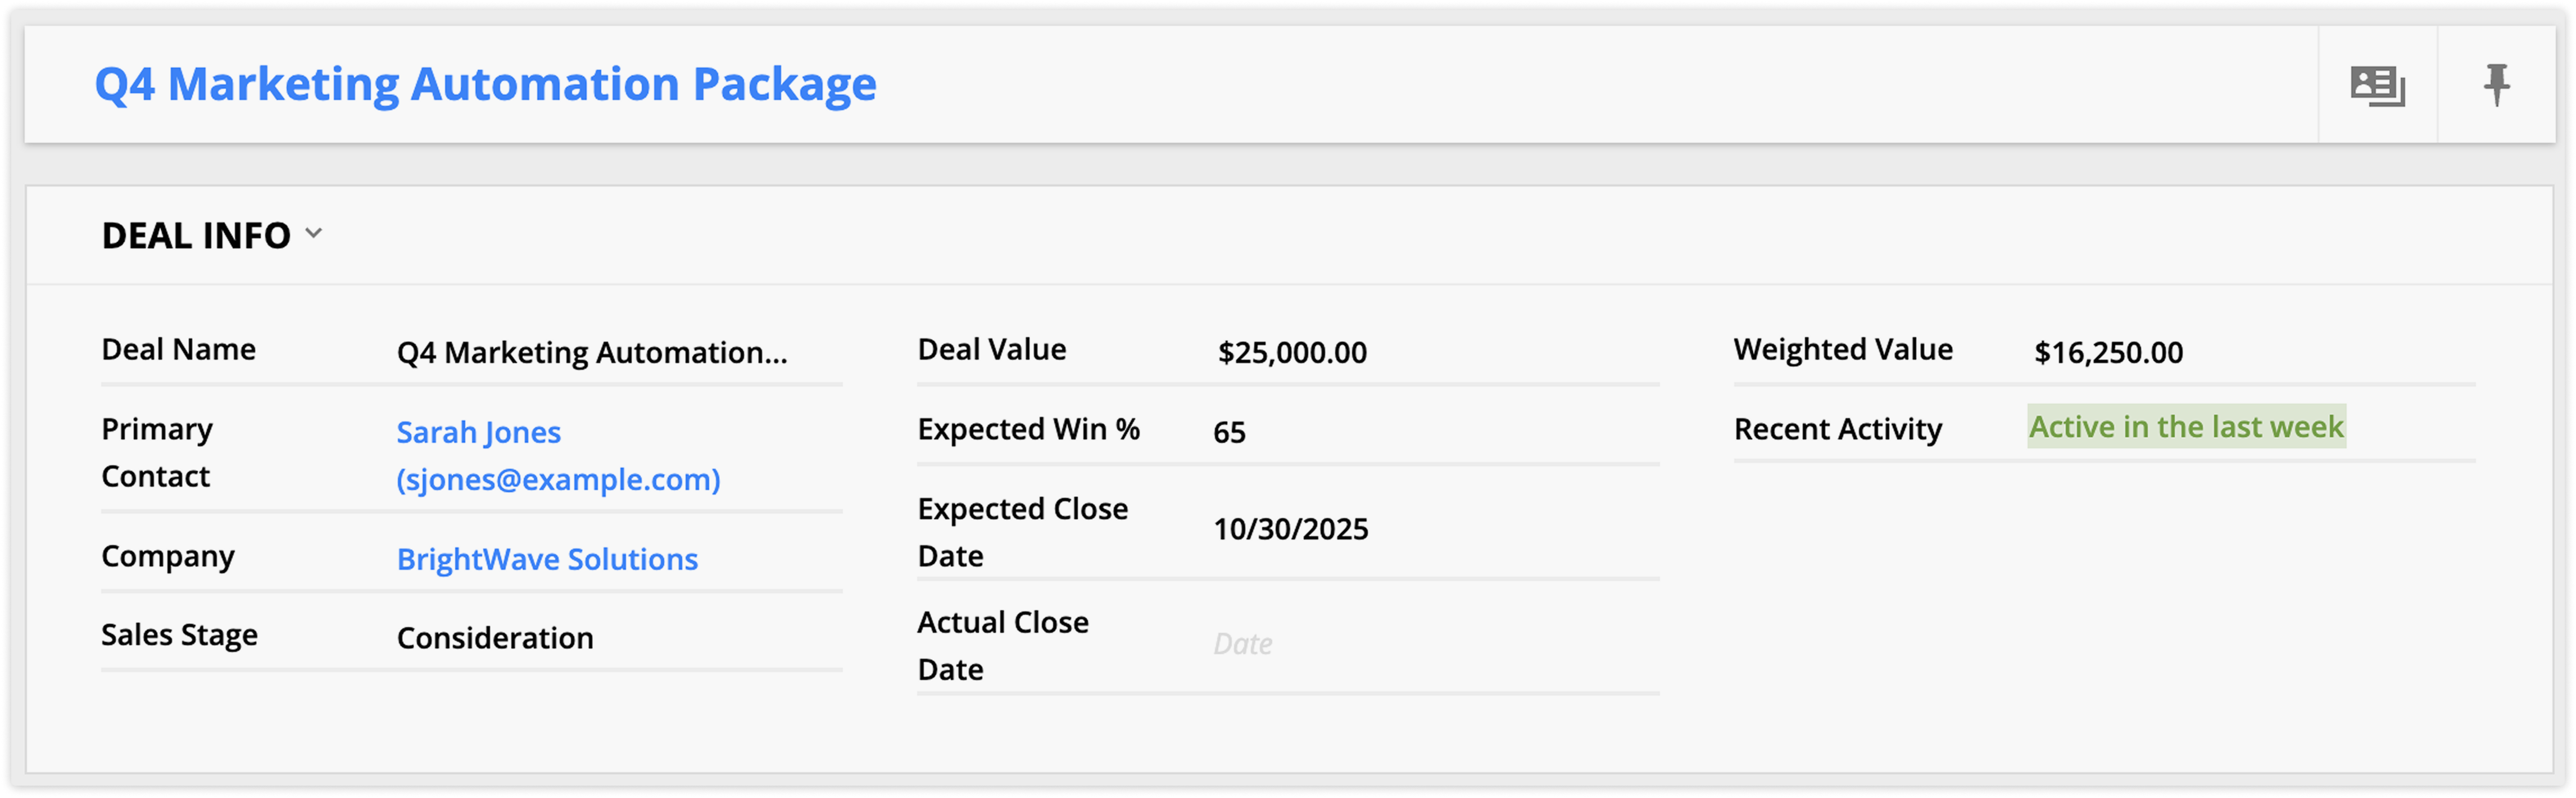
Deal Name: This is the name of your deal. You’ll see this label in your Deal pipeline and your stats pages.
Primary Contact: This relational field contains the name of the primary contact that your team communicates with while working to close your deal.
Company: If you have the Companies app enabled along with the Deals app, you'll see this relational field, which tells you the company's name associated with the deal.
Sales Stage: This dropdown field lets you mark each deal's stage in your sales cycle. This field is very helpful to use as columns in your Card View so you and your team can drag cards to update a deal’s status. If your rep books a demo with a lead, they can drag the deal’s card to the “Demo booked” column.
Deal Value: Add the value of your deal in this field. This field is used in several prebuilt automation maps to help you organize and track your deals so your team always knows which deals to focus on.
Expected Win %: Add the likelihood of you winning this deal. You can use previous deal history to determine the percentage.
Expected Close Date: This field contains the date you expect your deal to close.
Actual Close Date: This field saves the date that your deal closes. The "Deals app | Update actual close date" map updates this field. When you update a deal's status to "Close - Won," this map kicks off to capture the actual close date of your deal.
Weighted Value: Your sales team can use the weighted deal value to forecast your expected monthly or yearly revenue. The "Deals app | Calculate weighted value" map updates this field. The weighted value of a deal is a way to estimate how much money you might get from your deals. It's a realistic estimation because it considers how likely you are to win each deal.
This map takes your expected win percentage, multiples it by your deal value and multiplies that by .01.
In Card View, you can view the weighted value at the top of your columns to help you forecast your upcoming income.
Here's how it works.
In each deal record, you'll add how often you win deals similar to this deal. When the automation multiplies that percentage by your deal's value, you get the weighted value. The weighted value of a single deal shows you little. But when you add up all of the weighted values of your deals, you have an accurate estimate of how much income you'll earn from all the deals in your pipeline. The app does this for you automatically with the column headers in your Card View. When you view the total weighted value of all the deals at each stage, you view your projected income at each stage.
This type of forecasting helps you make better predictions and plan better because you are factoring in the possibility of losing some deals.
Recent Activity: This color field will show your deal's activity. Green means that the deal was active in the last week, yellow means active in the last month, and red indicates that it has been over a month since it was active.
The “Time since last activity color field” map updates this field. The automation map uses the “Last activity” default system field to determine when the deal’s related contacts last interacted with your business.
You can use this color field to display as columns in your Card View to catch deals as they become inactive.
Related contacts subcollection
This subcollection shows all the contacts related to the deal, making it easy to send updates to everyone involved.
This subcollection is connected to the subcollection in the “Deals tab” of Contact records named “Related Deals,” which shows you all of the deals the contact is related to.
Automatically updated fields
In the “System information” tab of deal records, there are a few fields used throughout your pipeline and deal stats pages that you never have to update. The app automatically updates all the custom fields in this section.
Deal Size: This color field shows you the size of your deal. The "Deals app | Set deal size color field" map updates this field. When you add a deal value to your record, the automation sorts each deal into the correct category.
Small deals are less than or equal to $1,000. Medium deals are over $1,000 but under $10,000, and large deals are over $10,000.
If you want to change this, edit the “Set deal size color field” map and update the “Deal is this value” conditions to fit your needs.
You can use this field as the columns of your Card View to quickly identify which deals your team should pay more attention to.
You can add this as a color field to your cards using other colors or dropdown fields as Card View columns.
Expected Close Timeframe: This dropdown field shows when you expect a deal to close. When you create a new Deal record, you'll add the date you expect to close the deal. When the "Expected Close Date" field is updated, the "Deals app | Update expected deal timeframe" map kicks off. It sets the correct timeframe based on your expected close date. The automation keeps updating the timeframe as your close date approaches.
You can use this dropdown field to display as columns on your Card View to monitor your upcoming closing deals.
Calc Field — Don’t Remove: This field is used to update the "Weighted Value" field. The "Deals app | Calculate weighted value" map requires it so it can calculate your weighted value before saving it to the correct field.
Contact records
This app adds two subcollections to your contact records.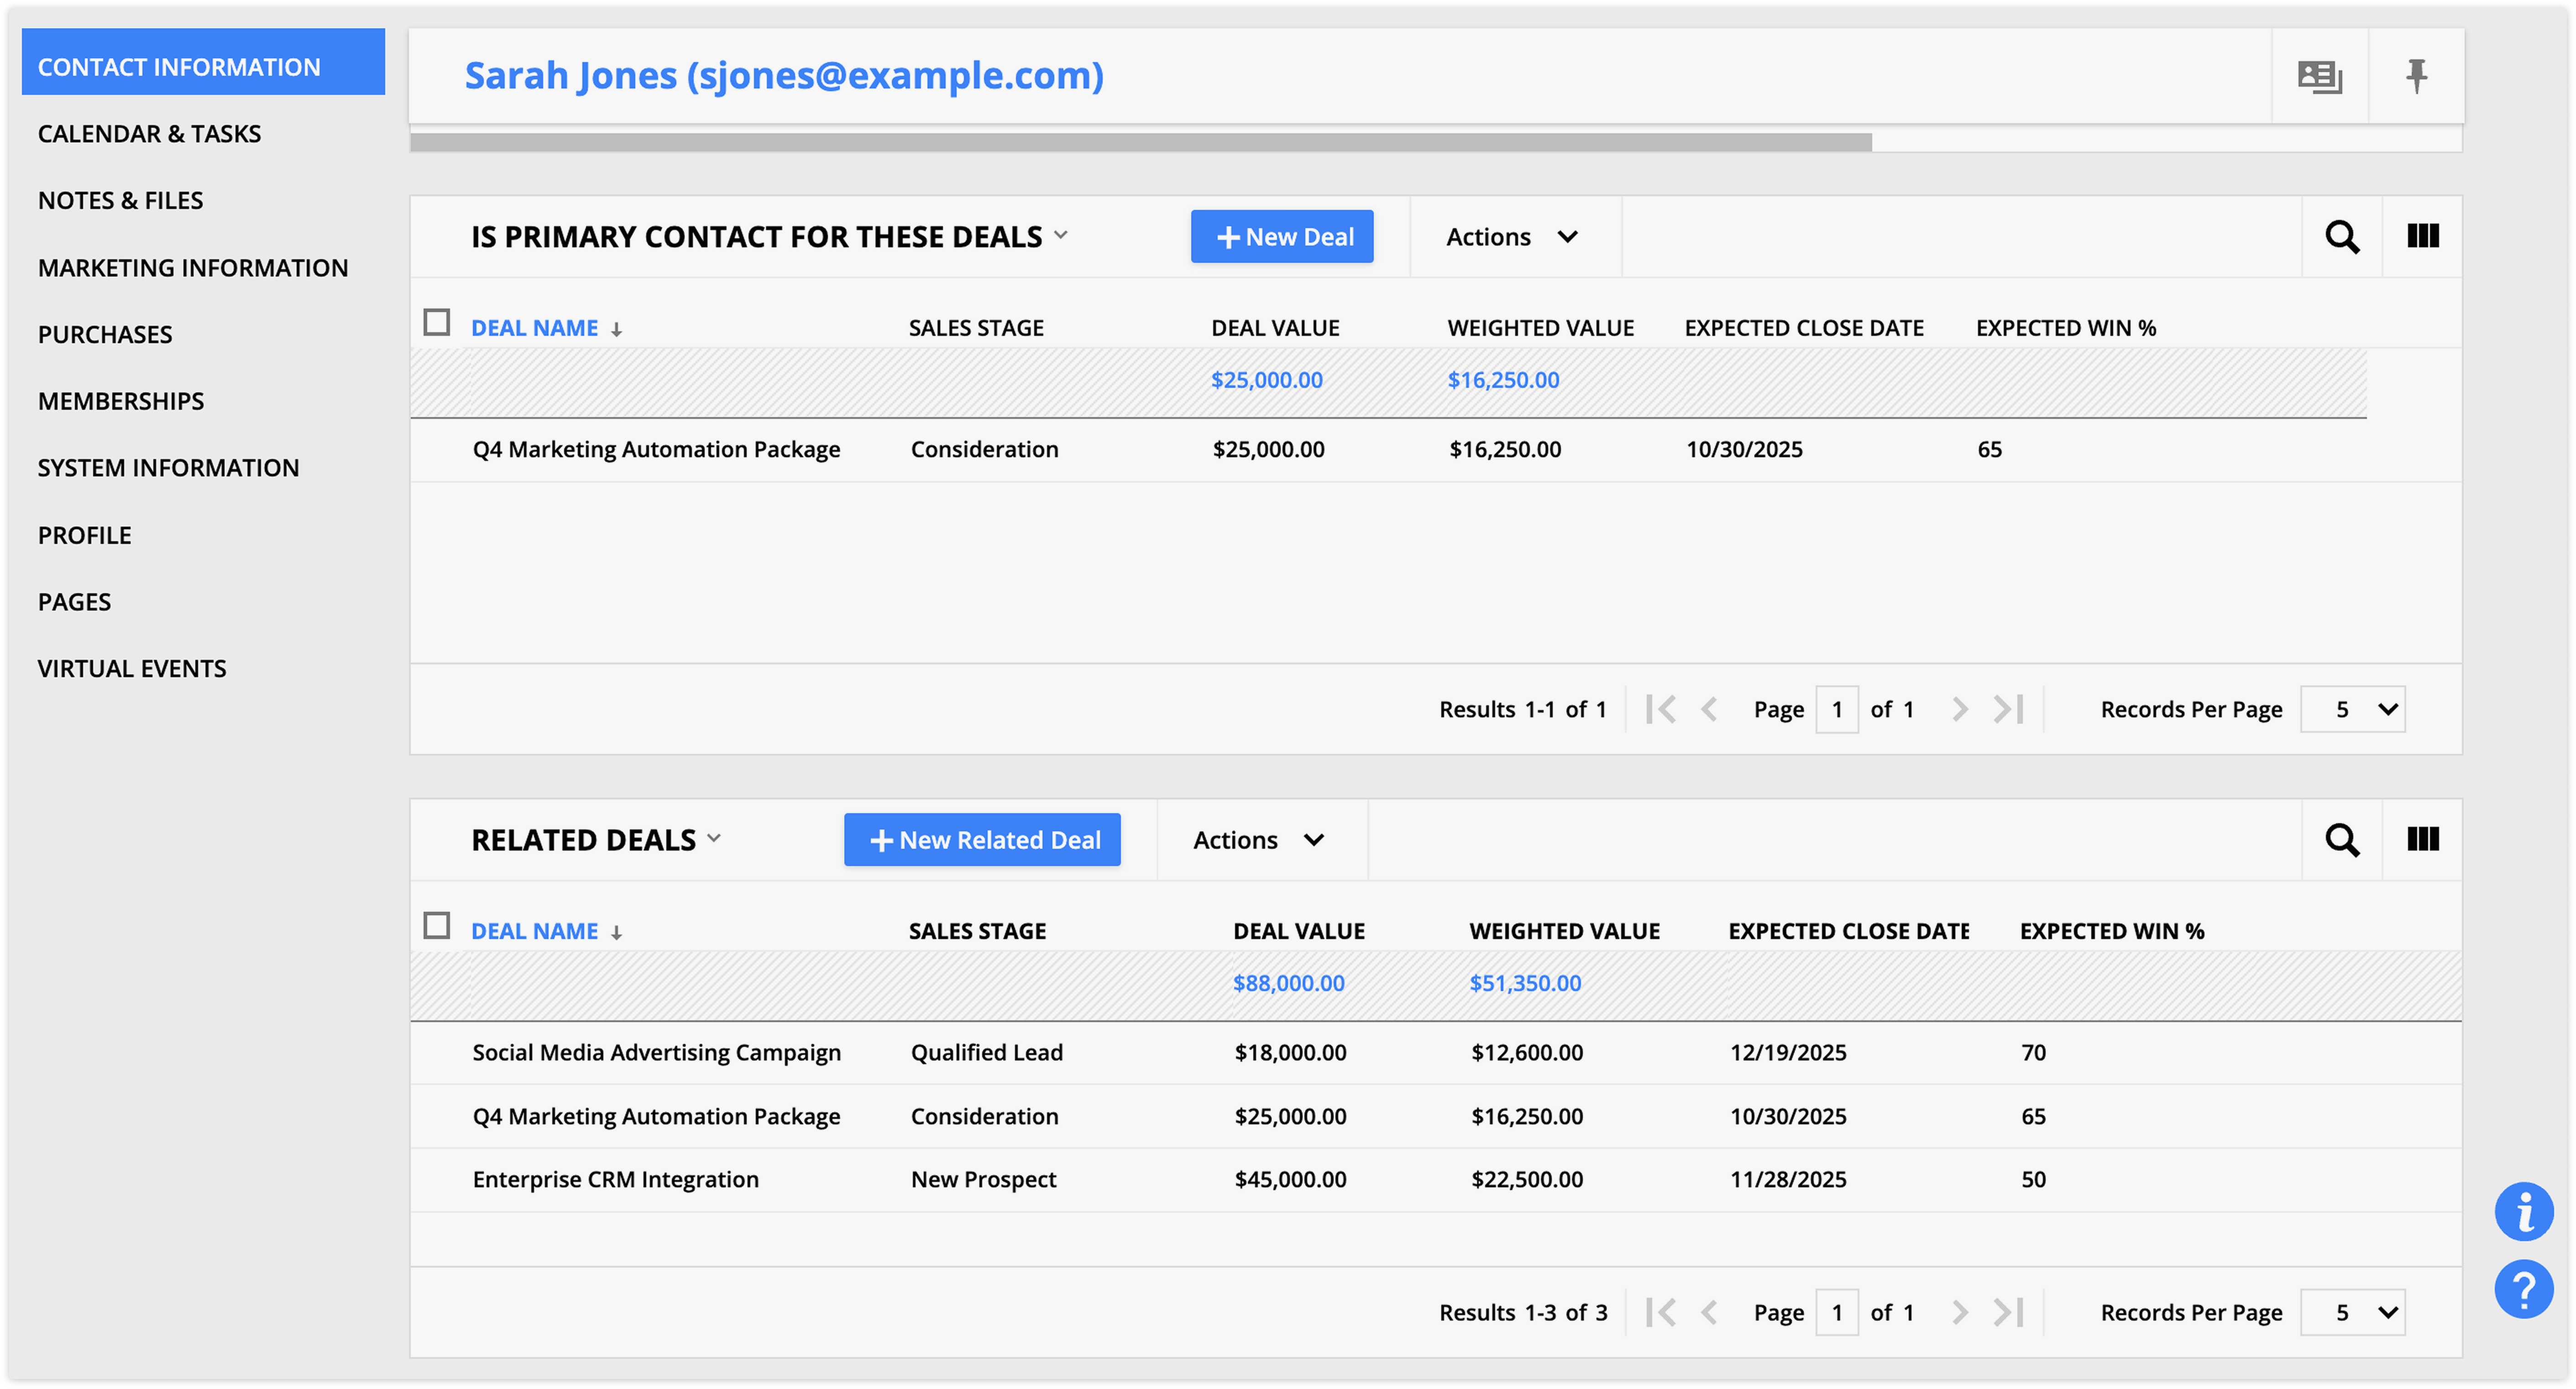
- Is the primary contact for these deals
- If your contact is the primary contact for multiple deals, you'll see them listed here.
- Related deals
- If your contact is related to multiple deals, you'll see them listed here.