Ontraport’s Metrics Dashboard shows you data in real-time so you can stay on top of the information that is most relevant to your business.
You can determine which stats you want to see on your Metrics Dashboard and Ontraport will automatically track them for you.
With options to name, categorize and refine each metric, your dashboard can be as simple or in-depth as you want.
Metrics are like single snapshots in time — they calculate stats for specific time frames. If you want to see your stats over time with line graphs, check out the Trends Dashboard. To get a visual of your metrics right on the automation map, use your map’s Performance Mode.
Metrics Dashboard is available to users with Ontraport Basic accounts and above.
Check out this Ontraport University lesson on the Metrics Dashboard:
Table of contents
Use cases
Create a new metric
• Choose the kind of metric you want
• Refine metrics with conditions
• Set your time frame
Dashboard settings
Why does my data look wrong?
Use cases
Here are some common ways to use dashboard metrics:
"I want to see how many new leads are coming from a specific region."
Select "Number of contacts who did something" with the trigger "Added to database", then add a condition, for example, "Country" is "Canada", to filter results down to that region only. Set the timeframe to "This month" to monitor your campaign's monthly growth.
"I want to see if refunds for a specific product are spiking recently compared to my yearly average."
Select "Number of contacts who did something", set the trigger to "Gets a refund on", and choose your specific product from the dropdown (e.g., "My Digital Product"). Then create two versions of this tile, one set to "This month" and another set to "Year to Date," and place them side by side for instant comparison. Since each metric is a single snapshot in time, viewing both together makes it easy to spot whether recent refunds are trending unusually high.
Pro tip: No need to build the second tile from scratch. Instead hover over your existing metric and click the copy icon to duplicate it, then simply swap the timeframe.
"I want to see my total revenue for the year, but only for completed days; not today's in-progress numbers."
Select "Total value of something across contacts" and set the trigger to when a contact purchases your product. Then set the timeframe to "Year to Date."
To exclude today's fluctuating data, navigate to Dashboard Settings in your data administration settings, where you can opt to leave out the current day from this metric.
"I want to know how effectively my landing page is converting visitors into buyers."
Select the "Conversion rate" metric category and set the timeframe to "Last 30 days", which gives you a rolling 30-day period ending yesterday.
Create a new metric
- Click Dashboard in your main navigation menu, then click the “Metrics” tab on the left.
- Click New metric and name your metric.
- This name acts as an identifier on the metric grid, so it’s helpful to name it based on what it measures.
- Select your metric’s object type. From the drop down, you can choose whether your metric relates to contacts or one of your custom objects.
- If you select a custom object, the contact specific metrics types will not be available.
- Select the type of metric you want to create.
- Select a trigger.
- Select a condition (optional).
- Select the time frame for your metric.
- Click Save.
.png)
Choose the kind of metric you want
There are seven categories your custom metrics can fall under:
- Number of contacts who did something
- Tracks the specific individuals who trigger an event. For example, the number of people who ask for a refund on a specific product, or the number of new leads added to your database from a specific country.
- Number of times something happened
- Tracks the overall volume of a specific event. For example, monitoring the total number of times a specific lead magnet form was submitted.
- Average number of times something happened per contact
- This metric calculates the typical frequency of a specific action among your contacts during a set timeframe. For example, tracking repeat buying behavior during a promotion.
- Conversion rate
- Evaluates performance over a period of time. For example, track how effectively a landing page turns visitors into buyers.
- Average time between two things happening
- Calculates the average duration between two specific events. For example, measuring your average sales cycle length. Set your first event trigger to "Added to database" and the second to "Purchases product" to find out exactly how long it takes, on average, for a new lead to convert into a paying customer.
- Total value of something across contacts
- Gives you a high-level view of accumulated value. For example, use it to monitor ongoing sales and total revenue for the current year by setting the trigger for when a contact purchases a product.
- Average value across contacts
- Calculates the average financial value generated per contact within your chosen time frame. For example, measure the average order value for a specific item.

Each one comes with its own set of triggers to choose from. These triggers are how Ontraport knows what to include in the stat.
For example if you choose the metrics category “Number of contacts who did something” and the trigger is “Gets a refund on a product,” the dashboard will only pull stats for the product you specified.
Additional settings for Conversion rate and Average time between two things happening metrics
These two metrics include an extra step when setting up your events.
Conversion Rate: How do you want to report the two events?
This setting controls whether the conversion is counted once per contact or every time it occurs.
- Once - The conversion is counted only the first time a contact completes the event.
- This is best for scenarios where a repeat action shouldn't count as a new conversion, such as a visitor signing up for your newsletter or making their first purchase.
- Repeating - Every instance of the conversion is counted, even if the same contact completes it multiple times.
- This works well for tracking recurring actions like repeat purchases or multiple form submissions.
Average Time Between Two Things Happening: How do you want to report the two events?
This setting determines which occurrence of the first event is used as the starting point for the time calculation.
- Use first occurrence - The calculation is anchored to the very first time a contact ever completed the first event, regardless of the selected timeframe.
- This is ideal when you want to measure the full journey from a contact's initial interaction — for example, the average time between someone first joining your list and eventually making a purchase.
- Both events must happen in timeframe - Only contacts who completed both events within the selected timeframe are included in the calculation.
- This is better suited for measuring recent behavior patterns, such as how quickly contacts who signed up this month went on to make a purchase.
Refine metrics with conditions
Adding a condition is optional but will make it so that your trigger will only activate if your additional specifications are met.
For example, if you want to track how many of your new contacts are from Canada, you can use a condition to filter your data to just show you new Canadian contacts.
To set this up, add the condition “Field is this value” and select the “Country” field and add the value “Canada.”
Set your time frame
Time frames add context to your metrics and allow you to pinpoint your reporting even further. If the time frame you’re looking for doesn’t appear in the dropdown, you can select “Custom date range” to create your own.
Note: time frames are set to the timezone of the Ontraport account, not the viewer of the metrics.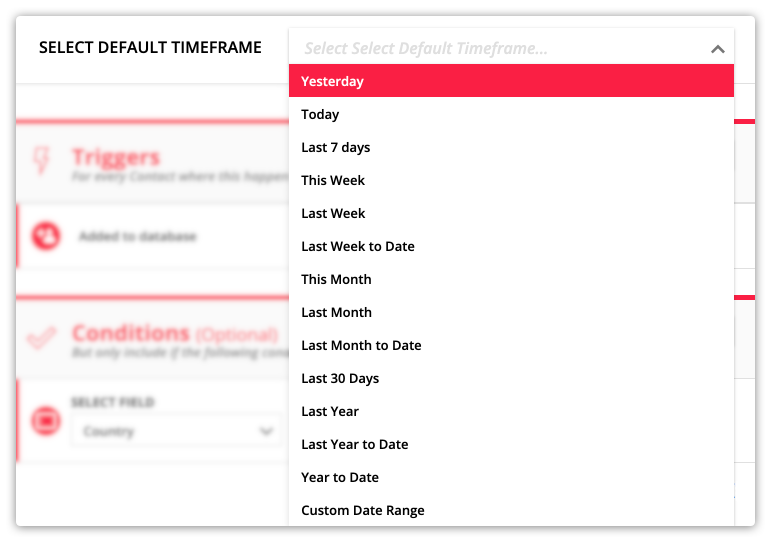
Here’s what each time frame means:
Time frame | Description | Example |
|---|---|---|
| Today | All day today | May 21, 2024 |
| Yesterday | All day yesterday | May 20, 2024 |
| Last 7 days | A rolling 7-day period that ends yesterday | May 14, 2024 – May 20, 2024 |
| This week | All days this week Follow these steps to exclude today’s data from this metric. | Sunday – today |
| Last week | All days last week | All days last week |
| Last week to date | Last week from Sunday to today’s day of the week | Last Sunday to May 14, 2024 |
| This month | All days between the first day of this month and today Follow these steps to exclude today’s data from this metric. | May 1 – May 21, 2024 |
| Last month | All days between the first and last days of last month | April, 2024 |
| Last month to date | All days between the first day of last month and today’s date last month | April 1 – April 21, 2024 |
| Last 30 days | A rolling 30-day period that ends yesterday | April 21, 2024 – May 21, 2024 |
| Last year | All days between Jan 1 and Dec 31 last year | January 1, 2023 – Dec 31, 2023 |
| Last year to date | All days between Jan 1 last year and today’s date last year | January 1, 2023 – May 21, 2023 |
| Year to date | All days between Jan 1 this year and today Follow these steps to exclude today’s data from this metric. | January 1, 2024 – May 21, 2024 |
| Custom date range | Choose any “From” and “To” dates | Your choice! |
Dashboard settings
By default, three metrics include data collected today:
- This week
- This month
- Year to date
You can update your dashboard's settings if you prefer not to include data collected today in those metrics.
Here’s how:
- Go to
.png) → Administration → Data → Dashboard.
→ Administration → Data → Dashboard. - Select “no” in the dropdown.

Why does my data look wrong?
If your metrics’ data doesn’t seem to be adding up, there are a couple things to consider:
- Ontraport holds historical data from the beginning of the previous year. That means if today is June 30, 2022 we can only guarantee the accuracy of that data back to January 1, 2021.
- We recommend that you always check the date ranges of your Metrics Dashboard, and select a time period that starts after January 1, 2021.
- Your metrics will show you data about ALL contacts that existed in your account in a specific time frame, even if you later deleted their records.
- If numbers in your Dashboard are not exactly matching up with sales report statistics, add the condition “Contact still exists” to your metric.
- If numbers in your Dashboard are not exactly matching up with sales report statistics, add the condition “Contact still exists” to your metric.


 .
.