Performance Mode is a view within each of your automation maps that allows you to keep track of automation results in real time. To get the most out of this view, it’s important to understand the various reports and stats that are available.
Performance Mode is available to all Ontraport users. For access to marketing ROI tracking stats and UTM tracking filters, you’ll need an Ontraport Pro account or above.
Table of contents
• Performance Mode reports
• Understanding Performance Mode stats
• Filtering the stats
• Locating a contact's path in an automation
Performance Mode reports
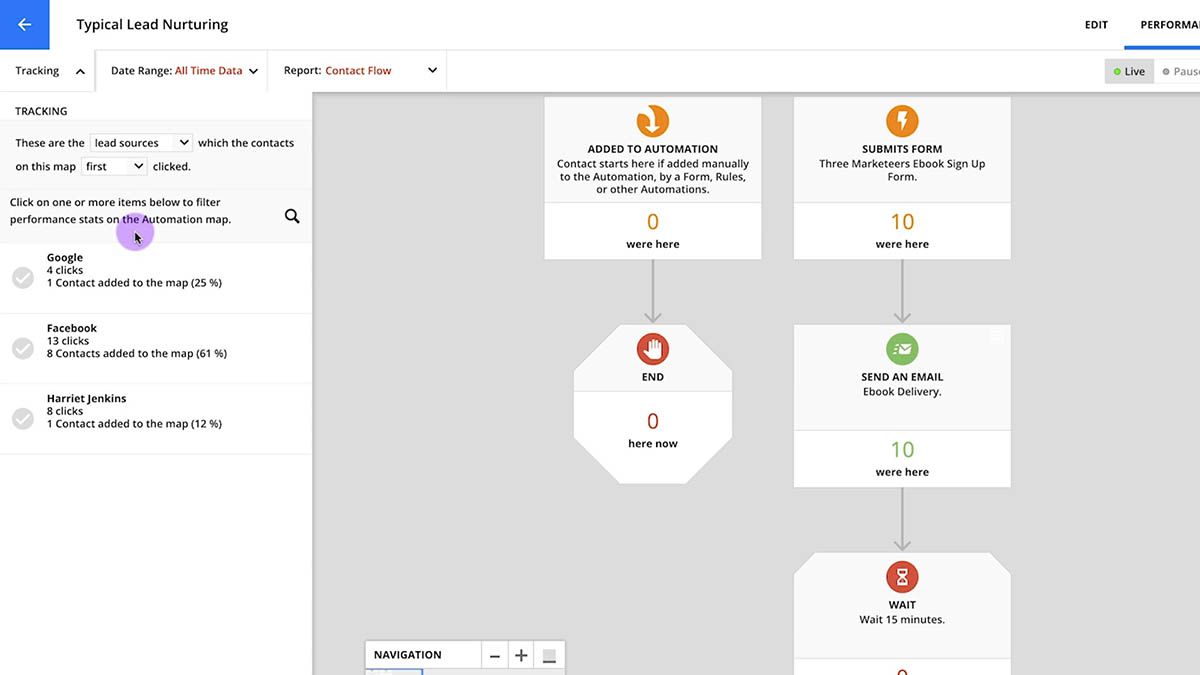
To view Performance Mode, click on Performance in the top right.

The report dropdown gives you six options to choose from, each displaying a different set of stats about your contacts’ automation journey:
.png)
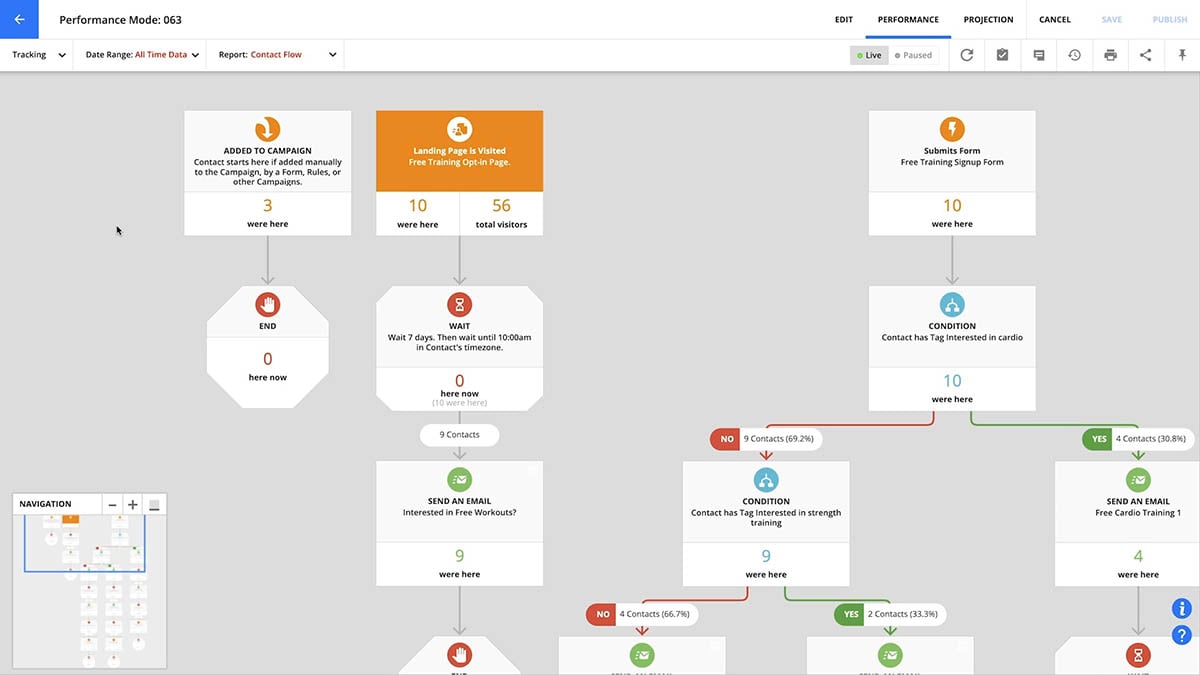
- Contact Flow Reports: See how contacts have moved through your automation map and find out where they are now.
- Funnel Conversion Reports: Monitor conversion rates from goal to goal starting with a trigger.
- Lifetime Value Reports: Find out the total and average amount of money spent by the contacts who hit any element.
- Goal Conversion Rate: Learn how well the elements of your automation are performing and which ones are most effective.
- Goal Conversion Point: Get an in-depth look at which elements are most effective at driving conversions. When you click on each goal element within your automation, this report will show you where contacts were on your map when they converted.
- Goal Conversion Time: See how long it took new leads to achieve each automation goal. This can help you forecast how long it will take future leads to convert from any given lead source.
Understanding Performance Mode stats
Back to top
As you navigate through the reports in Performance Mode, you’ll see all the stats below. Here’s what each one means:
- Contacts were here: The total number of contacts who visited a particular element, but are not there now
- Contacts here now: The total number of contacts who are currently sitting on an element
- Contacts’ conversion rate: The rate at which contacts achieve the desired action (found on goals only)
- Conversion time: The average amount of time it took a contact to achieve a selected goal from a particular element
- Conversion point: The number and percentage of users who achieved the selected goal from a particular element
- Total visitors: The total number of visitors a page has received (on trigger elements only)
- Amount spent and average spent: The overall amount and the average amount of money contacts spent (on all products, all time) when they hit each element when viewing the Lifetime Value report
- Email stats: The number of sends, opens, clicks and opt-outs an email message has received
- Connector stats: There are two different types of stats that appear on the path (the grey line between elements). These connector stats are:
- # of contacts: The number of contacts that went down this path
- % of contacts: The % of contacts that went down this path
Filtering the stats
If you have an Ontraport Pro account or above and have UTM tracking enabled, you can also filter your stats by UTM parameters. Here’s how to use tracking filters in your automation maps.
Locate a contact's path in an automation
Want to see exactly where a specific contact has been and where they are right now in an automation? You can trace their path directly from the automation map using a URL parameter.
How do I find a contact or object record's path and their current spot in an automation?
- Find the contact record ID.
- You can find the ID in the system information tab or in the URL of your contact’s record.
- Open the automation.
- Make sure you're in Performance mode.
- Edit the URL by adding &contact_id={contact ID} to the end.
- For example &contact_id=102
- Refresh your browser window (Mac: Command + R | Windows: Ctrl + F5).
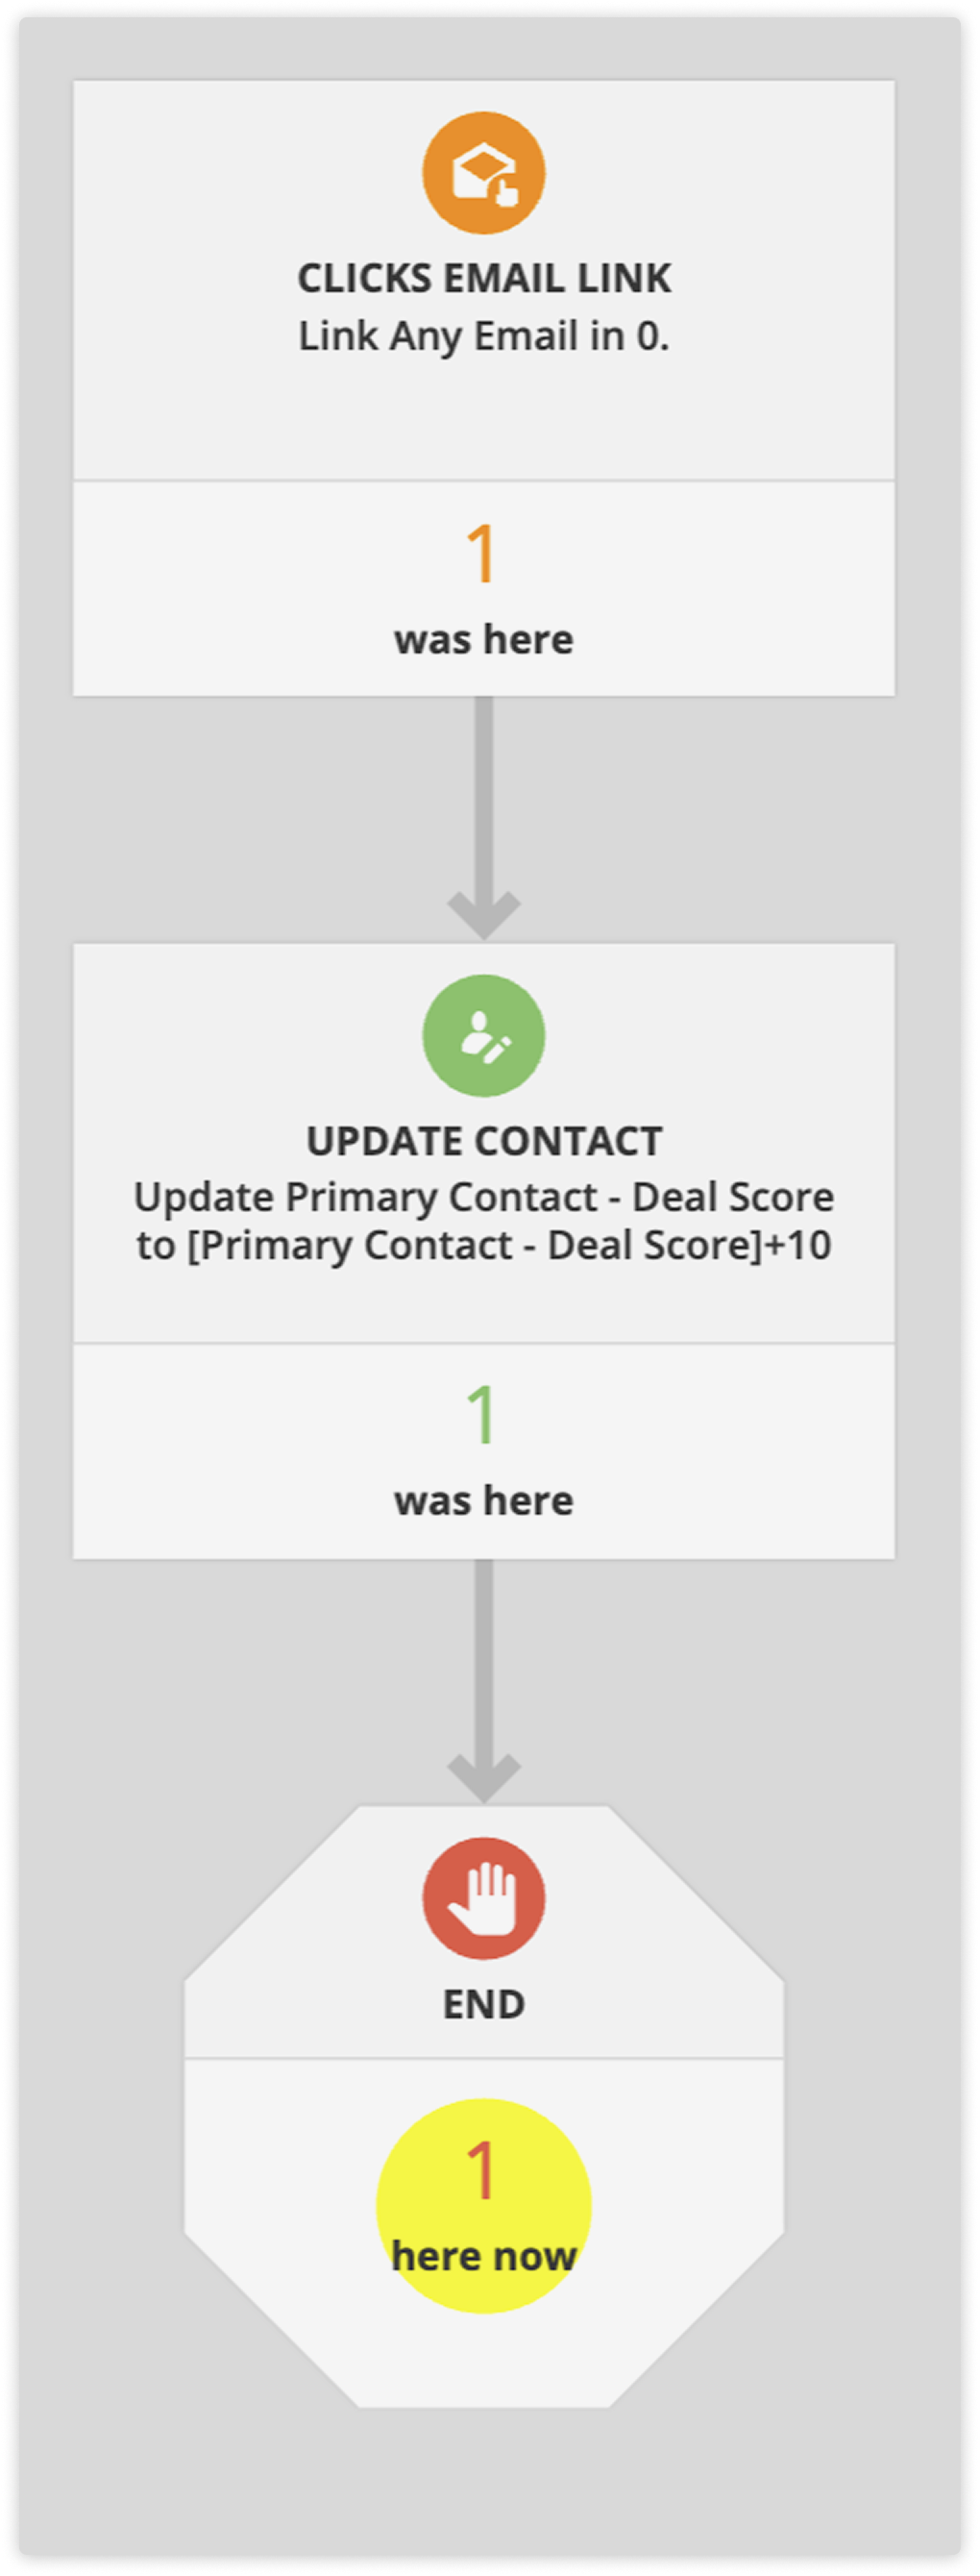
Once the page reloads, the automation map will update to show:
- A 1 on each element the contact has passed through
- A yellow circle highlighting where the contact is currently waiting in the automation
Locating other records
Follow the same steps as above to regardless of what object type you're working with, you can use &contact_id=XXXX to trace the path and pinpoint the current location of any specific record. Simply use the record's system ID in place of the contact ID number.
Download a prebuilt automation map Reporting: Customer lifetime value in first three years See how much your new leads and customers are spending over the first three years. Gain valuable insights to optimize your marketing and sales strategies for maximum ROI. Click here to download. Reporting: High level customer lifecycle Track your contacts’ journeys from lead to loyal customers. This automation map helps you visualize the entire customer lifecycle, from initial contact to repeat purchases and referrals. Gain valuable insights into customer behavior and optimize your marketing efforts. Click here to download. |